
Image
|
Figure Caption
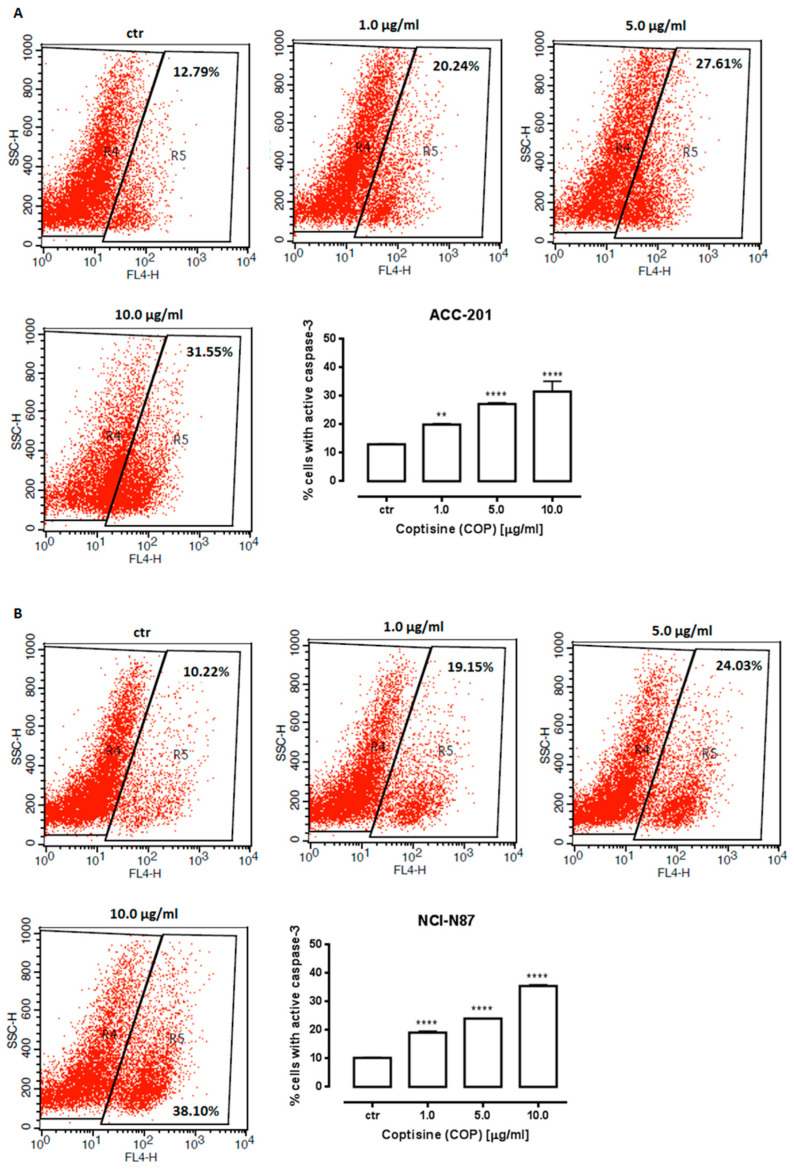
Fig. 6
Representative flow cytometry dot plot graphs of ACC-201 (A) and NCI-N87 (B) gastric cell lines after the treatment with a medium (ctr) and coptisine (11). Region R5 included apoptotic cells with active caspase-3. Results are presented as mean ± SD at each concentration (** p < 0.01; **** p < 0.0001 vs. control group; Tukey’s post-hoc test), n = 5 per concentration from three independent experiments.
Acknowledgments
This image is the copyrighted work of the attributed author or publisher, and
ZFIN has permission only to display this image to its users.
Additional permissions should be obtained from the applicable author or publisher of the image.
Full text @ Int. J. Mol. Sci.