
Image
|
Figure Caption
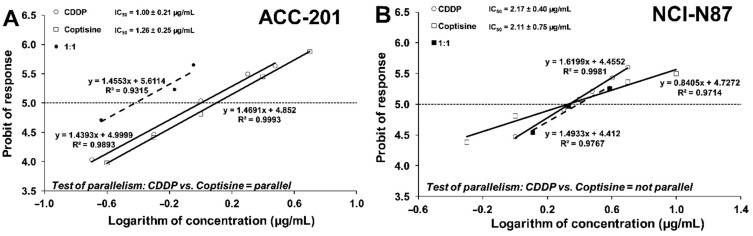
Fig. 8
Log-probit dose–response relationship curves (DRRCs) for cisplatin (CDDP) and coptisine (11) administered alone, and in combinations at the fixed ratio of 1:1 (dotted line), illustrating the anti-proliferative effects of the drugs in the human gastric cancer cell lines ACC-201 (A) and NCI-N87 (B) measured in vitro by the MTT assay.
Acknowledgments
This image is the copyrighted work of the attributed author or publisher, and
ZFIN has permission only to display this image to its users.
Additional permissions should be obtained from the applicable author or publisher of the image.
Full text @ Int. J. Mol. Sci.