
Image
|
Figure Caption
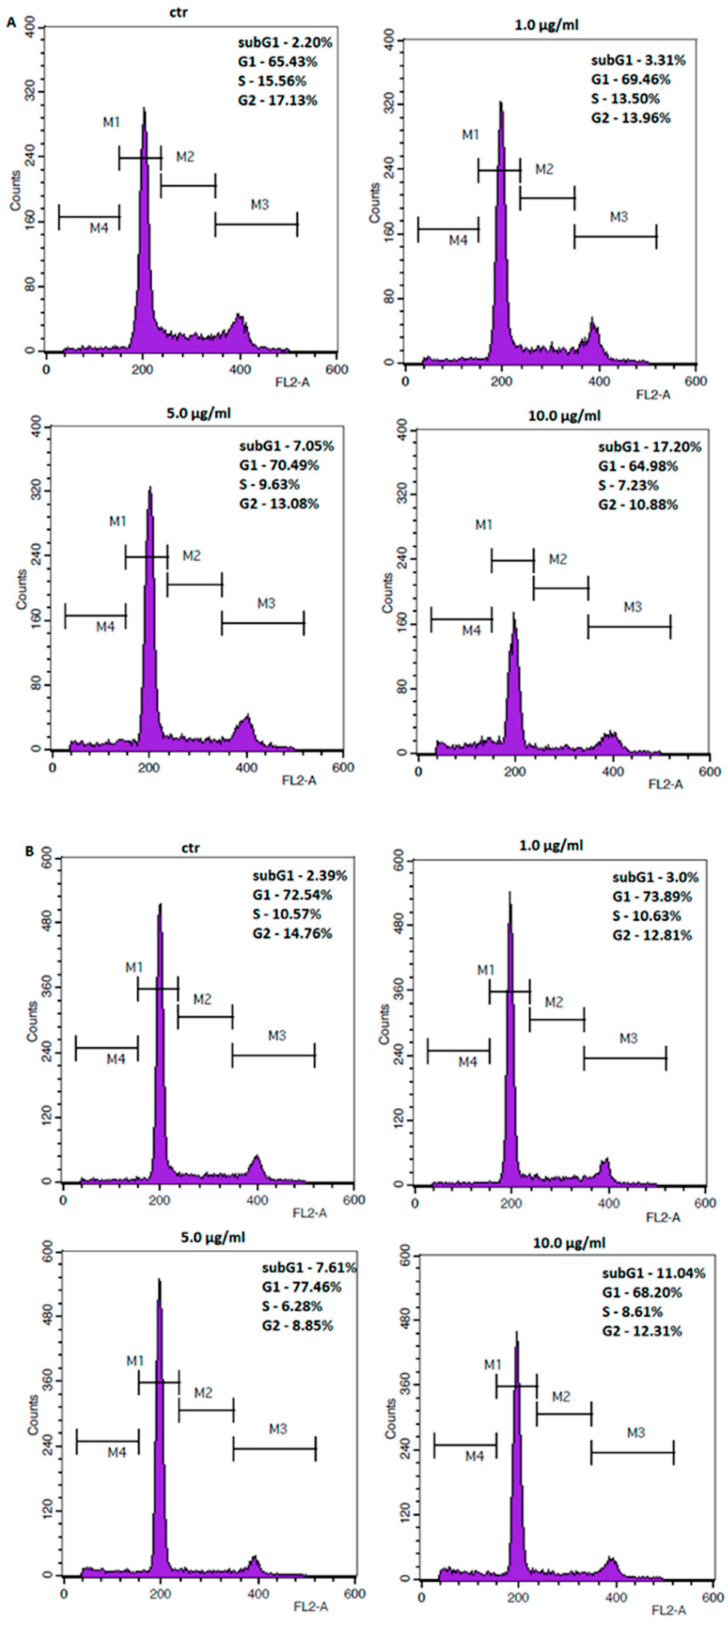
Fig. 5
Representative flow cytometry histogram peaks of the ACC-201 (A) and NCI-N87 (B) gastric cancer cell lines after the treatment with a medium (ctr) and coptisine (11). Region M1, M2, M3 and M4 included G1, S, G2 and subG1 phase, respectively.
Acknowledgments
This image is the copyrighted work of the attributed author or publisher, and
ZFIN has permission only to display this image to its users.
Additional permissions should be obtained from the applicable author or publisher of the image.
Full text @ Int. J. Mol. Sci.