
- Title
-
Synergistic protective effects of folic acid and resveratrol against fine particulate matter-induced heart malformations in zebrafish embryos
- Authors
- Chen, J., Zhang, M., Zou, H., Aniagu, S., Jiang, Y., Chen, T.
- Source
- Full text @ Ecotoxicol. Environ. Saf.
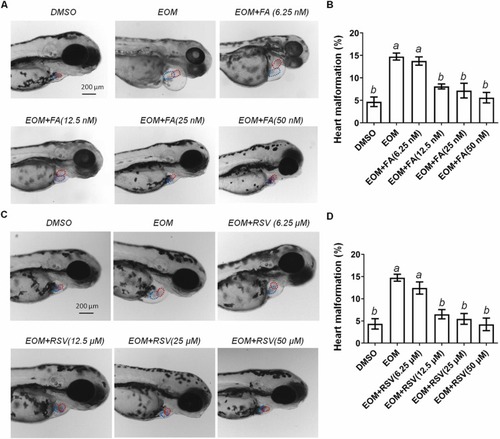
Fig. 1. Protective effects of FA or RSV at different concentrations on EOM-induced heart defects in zebrafish embryos at 72 hpf. (A, C) Representative images of zebrafish embryos; dotted lines encircle the atrium (red) or ventricle (blue). (B, D) Heart malformation rates. Different letters (a,b) indicate significant differences. |
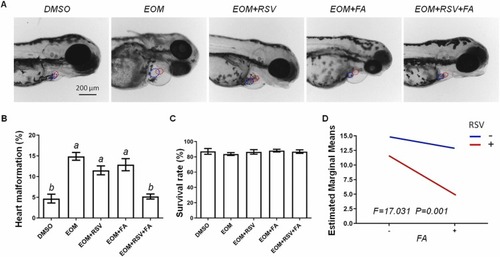
Fig. 2. RSV plus FA synergistically protected EOM-induced heart defects in zebrafish embryos at 72 hpf. (A) Representative images; dotted lines encircle the atrium (red) or ventricle (blue). (B) Heart malformation rate. (C) Survival rate. (D) Synergistic interaction analysis. Different letters (a,b) indicate significant differences. PHENOTYPE:
|

Fig. 3. The effect of RSV, FA and RSV plus FA on EOM-induced AHR activity in the hearts of zebrafish embryos at 72 hpf. (A) EROD signals and the quantification results; the white dashed-line squares indicate heart area; (B) Synergistic interaction illustrated by interaction plots; (C) mRNA expression levels. Different letters (a,b) indicate significant differences. EXPRESSION / LABELING:
PHENOTYPE:
|
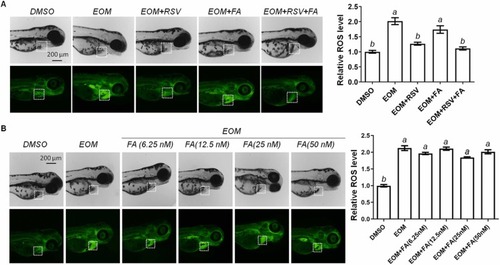
Fig. 4. ROS signals in the hearts of zebrafish embryos at 72 hpf and the quantification results. (A) The effect of RSV, FA and RSV plus FA on EOM-induced ROS production; the white dashed-line squares indicate heart area; (B) The effect of FA at different concentrations. Different letters (a,b) indicate significant differences. PHENOTYPE:
|
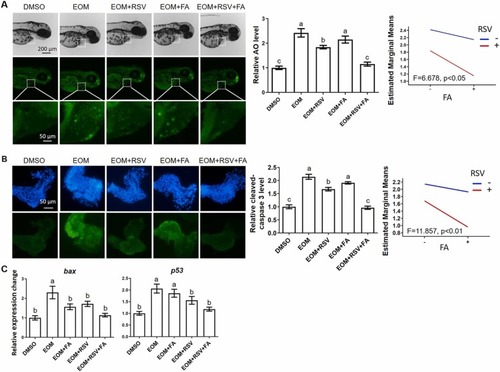
Fig. 5. The effect of RSV, FA and RSV plus FA on EOM-induced apoptosis in the hearts of zebrafish embryos at 72 hpf. (A) AO staining, the quantification results and synergistic interaction; (B) Cleaved caspase-3 staining of isolated hearts, the quantification results and synergistic interaction; (C) mRNA expression from isolated hearts. Different letters (a-c) indicate significant differences. EXPRESSION / LABELING:
PHENOTYPE:
|

Fig. 6. Protective effects of VC at different concentrations or VC plus FA on EOM-induced heart defects in zebrafish embryos at 72 hpf. (A, B) Representative images of zebrafish embryos exposed to VC at different concentrations and heart malformation rates; dotted lines encircle atrium (red) or ventricle (blue). (C, D). Representative images of zebrafish embryos exposed to VC, FA and VC plus FA and the relevant heart malformation rates; E) Synergistic interaction illustrated by interaction plots; different letters (a,b) indicate significant differences. PHENOTYPE:
|
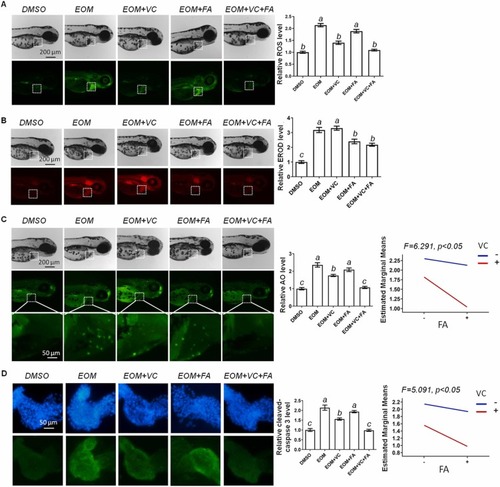
Fig. 7. The effect of RSV, FA and RSV plus FA on EOM-induced AHR activity, ROS production and apoptosis in the hearts of zebrafish embryos at 72 hpf. (A) ROS production and the quantification result; the white dashed-line squares indicate heart area. (B) EROD signals for AHR activity and the quantification result. (C) AO staining, quantification result, and synergistic interaction; (D) Cleaved caspase-3 staining of isolated hearts, quantification result, and synergistic interaction; different letters (a-c) indicate significant differences. PHENOTYPE:
|