
Image
|
Figure Caption
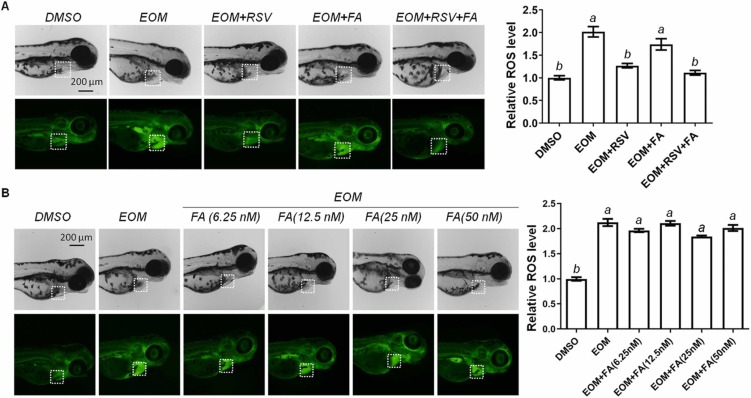
Fig. 4 Fig. 4. ROS signals in the hearts of zebrafish embryos at 72 hpf and the quantification results. (A) The effect of RSV, FA and RSV plus FA on EOM-induced ROS production; the white dashed-line squares indicate heart area; (B) The effect of FA at different concentrations. Different letters (a,b) indicate significant differences.
Figure Data
Acknowledgments
This image is the copyrighted work of the attributed author or publisher, and
ZFIN has permission only to display this image to its users.
Additional permissions should be obtained from the applicable author or publisher of the image.
Full text @ Ecotoxicol. Environ. Saf.