
- Title
-
Single-cell transcriptomic analysis of vascular endothelial cells in zebrafish embryos
- Authors
- Gurung, S., Restrepo, N.K., Chestnut, B., Klimkaite, L., Sumanas, S.
- Source
- Full text @ Sci. Rep.

The scRNA-seq analysis of etv2ci32Gt; UAS:GFP; kdrl:mCherry embryos at the 24 hpf stage. (A) Schematics of the experimental design for scRNA-seq. (B) UMAP plot of 10,818 cells with 17 distinct clusters. Classifications were based on previously known marker genes which were significantly enriched in each cluster. RBC, red blood cells; VE, vascular endothelial; EPC, endothelial progenitor cells. (C) UMAP plot showing the distribution of GFP + mCherry + and GFP + mCherry- cells. (D) A heatmap showing expression of top marker genes in different clusters. Enlarged heatmap and gene list is shown in Fig. S1. (E) Fraction of GFP + mCherry + and GFP + mCherry- cells within each cluster. (F) A dot plot showing the expression of selected marker genes in different clusters. |

Arterial cluster #1. (A,B) UMAP feature plots showing expression of selected arterial top markers dll4 and flt1. (C,D) Violin plots showing expression of dll4 and flt1 in different cell populations. (E) List of top 20 marker genes differentially expressed in arterial cluster. (F) List of top 20 pathways enriched in arterial cluster. (G,H) In situ hybridization analysis at 24 hpf for selected marker genes esm1 and notchl. Note the expression of esm1 and notchl in the dorsal aorta (arrowhead) as well as the intersegmental vessels (arrow). Scale bars: 100 μm. EXPRESSION / LABELING:
|

Venous-1 cluster #2. (A,B) UMAP feature plots showing expression of selected top markers for cluster #2, lyve1b and si:dkey-28n18.9. (C,D) Violin plots showing expression of lyve1b and si:dkey-28n18.9 in different cell populations. (E) List of top 20 marker genes differentially expressed in Venous-1 cluster. (F) List of top 20 pathways enriched in Venous-1 cluster. (G,H) In situ hybridization analysis at 24 hpf for previously uncharacterized genes bcl6b and si:dkey-28n18.9. Note the expression of bcl6b and si:dkey-28n18.9 in the posterior cardinal vein (arrowheads). Scale bars: 100 μm. EXPRESSION / LABELING:
|
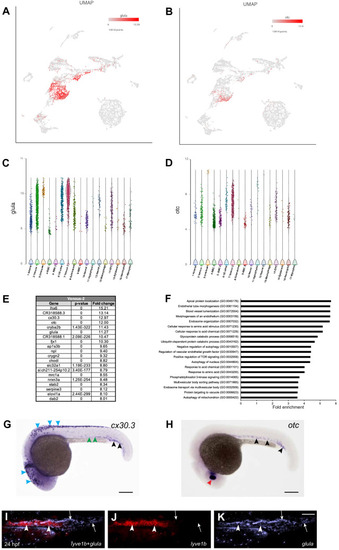
Venous-2 cluster #7. (A,B) UMAP feature plots showing expression of selected top markers for cluster #7, glula and otc. (C,D) Violin plots showing expression of glula and otc in different cell populations. (E) List of top 20 marker genes differentially expressed in Venous-2 cluster. (F) List of top 20 pathways enriched in Venous-2 cluster. (G) In situ hybridization analysis at 24 hpf for a previously uncharacterized marker gene cx30.3. Note the expression of cx30.3 in the caudal vein (black arrowheads) and weak expression in the PCV (green arrowheads). cx30.3 is also expressed in melanocytes (blue arrowheads). (H) In situ hybridization analysis at 24 hpf for a marker gene otc. Note the expression of otc in the CV, PCV (black arrowheads) and the lens (red arrowhead). Scale bars: 200 μm. (I–K) Two color fluorescent ISH analysis for the expression of lyve1b and glula at the 24 hpf stage. Note that many cells in the CV are positive for glula and not lyve1b (arrows), while cells with strong lyve1b expression in the PCV have only weak glula expression (arrowheads). Trunk and tail region is shown, anterior is to the left. PCV posterior cardinal vein, CV caudal vein. Scale bar in (K), 50 μm for (I–K). EXPRESSION / LABELING:
|

Vascular endothelial (VE)-other cluster #6. (A,B) UMAP feature plots showing expression of selected markers for cluster #6, cldn5b and dab2. (C,D) Violin plots showing expression of cldn5b and dab2 in different cell populations. (E) List of top 20 genes differentially expressed in Vascular endothelial (VE)-other cluster. (F) List of top 20 pathways enriched in Vascular endothelial (VE)-other cluster. |
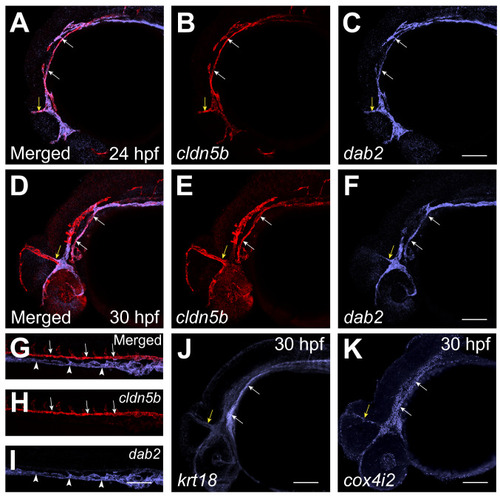
Vascular endothelial (VE)-other cluster #6 corresponds to cells in cranial vasculature. (A–F) Two color fluorescent ISH analysis for the expression of cldn5b and dab2 at the 24 hpf and 30 hpf stages. Note that cldn5b and dab2 are co-expressed in the PHBC (white arrows) and MCeV (yellow arrows) at the 24 hpf and 30 hpf stages. (G–I) Two color fluorescent ISH analysis for the expression of arterial cldn5b and venous dab2 in the trunk region of 24 hpf embryos. Note that cldn5b and dab2 have distinct non-overlapping expression in the DA (arrows) and PCV (arrowheads) respectively. (J,K) Fluorescent ISH analysis for the expression of krt18 and cox4i2 in the head region of 30 hpf embryos. Both markers are expressed in the PHBC (white arrows) and MCeV (yellow arrows). PHBC primordial hindbrain channels, MCeV mid cerebral vein, DA dorsal aorta, PCV posterior cardinal vein. Scale bars: 100 μm. |

Endothelial progenitor cell (EPC) cluster. (A,B) UMAP plots showing expression of selected EPC top markers npas4l and etv2. (C,D) Violin plots showing expression of selected arterial marker genes npas4l and etv2 in different cell populations. (E) List of top 20 genes differentially expressed in the EPC cluster. (F) List of top 20 pathways enriched in the EPC cluster. (G) Developmental trajectory plot of vascular endothelial cells generated using Monocle 3. |

Endocardial subcluster. (A) Endocardial cells were identified based on the expression of markers genes gata5 and nfatc1 (log2 > 0). (B,C) UMAP feature plots showing expression of gata5 and nfatc1. (D) List of top 30 genes differentially expressed in the endocardial subcluster. (E–G) In situ hybridization analysis at 24 hpf for selected endocardial enriched genes wnt11r, bambib and bmp16. Note the expression of wnt11r, bambib and bmp16 within the heart tube (arrowhead). Ventral view of deyolked and flat-mounted embryos, anterior is to the left. Scale bars: 100 μm. |