
- Title
-
Muscarinic acetylcholine receptors regulate inflammatory responses through arginases 1/2 in zebrafish
- Authors
- Chen, A.Q., He, S.M., Lv, S.J., Qiu, C.Z., Zhou, R., Zhang, L., Zhang, S.R., Zhang, Z., Ren, D.L.
- Source
- Full text @ Biomed. Pharmacother.
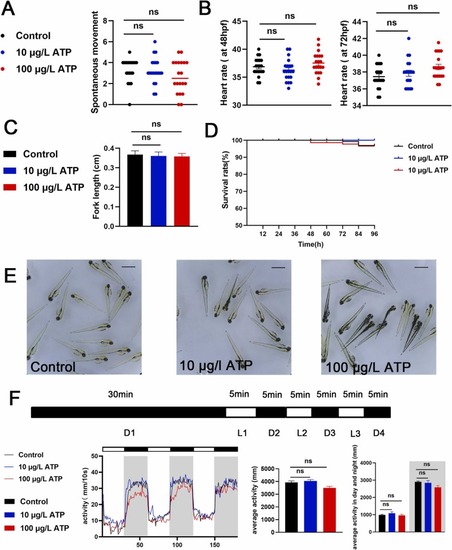
Fig. 1. Atropine had no significant effect on the growth, development and activity of zebrafish larvae. (A) Times of tail wagging of 30 hpf larval zebrafish (times/min, n = 15). (B) Heart rate of 48 hpf, 72 hpf larval zebrafish (times/20 s, n = 15). (C) Body length of 96 hpf zebrafish larvae (cm, n = 15). (D) 0–96 hpf larvae survival curve (%, n = 15). (E) Morpha of 96 hpf zebrafish under a stereomicroscope. (F) PMR behavior of zebrafish larvae monitored by Viewpoint (n = 16). ATP in the figure represents atropine, The analysis showed that there was no obvious difference between atropine and control group. (*P < 0.05, ** P < 0.01, ***P < 0.001, one-way ANOVA analysis, LSD for port-hoc test). |
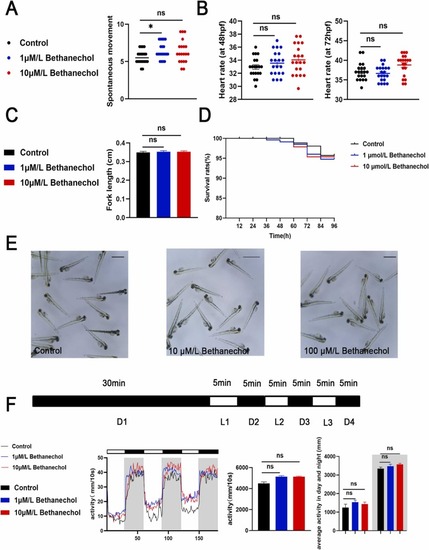
Fig. 2. Bethanechol treatment showed no significant effect on the growth, development and activity of zebrafish larvae. (A) Times of tail wagging of 30 hpf larval zebrafish (times/min, n = 15). (B) Heart rate of 48 hpf, 72 hpf larval zebrafish (times/20 s, n = 15). (C) Body length of 96 hpf zebrafish larvae (cm, n = 15). (D) 0–96 hpf zebrafish survival curve (%, n = 15). (E) Morpha of 96 hpf zebrafish under a stereomicroscope. (F) PMR behavior of zebrafish larvae monitored by Viewpoint (n = 16). Bet in the figure represents bethanechol. The results showed that there was no obvious difference between bethanechol and control group. (*P < 0.05, ** P < 0.01, ***P < 0.001, one-way ANOVA analysis, LSD for port-hoc test). |
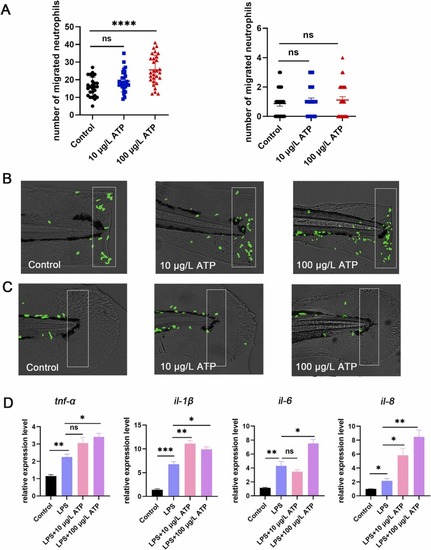
Fig. 3. Inhibition of mAChRs up-regulated neutrophils migration and increased proinflammatory cytokines level. (A) Neutrophils were photographed with a fluorescence microscope (n = 25), and neutrophils migration increased after atropine (0.003 μM, 0.03 μM) treatment in the statistical area. The caudal fin was not injured in the right picture, and the caudal fin was injured in the left picture. (B) Model of caudal fin injury: atropine (0.003 μM, 0.03 μM) treated or untreated caudal fins of zebrafish were cut with a scalpel blade (white rectangles indicate statistical areas). (C) When the zebrafish caudal fin was not damaged, there was no difference in the number of neutrophils in the statistical area between atropine (0.003 μM, 0.03 μM) and the control group (the white rectangles indicate the statistical area). (D) The expression levels of tnf-α, il-1β, il-6 and il-8 in zebrafish treated with atropine (0.003 μM, 0.03 μM) were increased compared with the LPS group (n = 30). (*P < 0.05,** P < 0.01, ***P < 0.001, ****P < 0.0001, one-way ANOVA analysis, LSD for port-hoc test). EXPRESSION / LABELING:
PHENOTYPE:
|
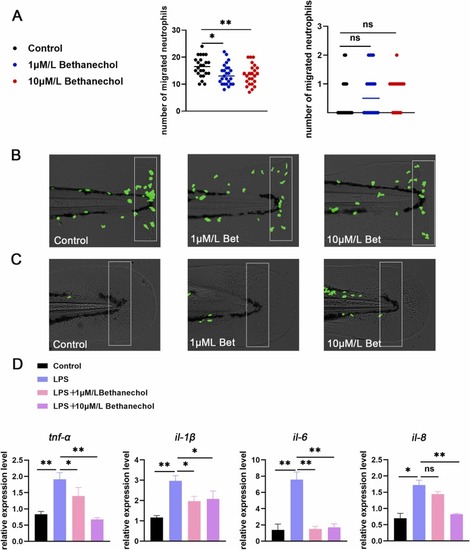
Fig. 4. Activation of mAChRs down-regulated neutrophils migration and reduced proinflammatory cytokines level. (A) Neutrophils were photographed with a fluorescence microscope (n = 25), and neutrophils migration was reduced after treatment with bethanechol (1 μM, 10 μM) in the statistical area. The caudal fin was not injured in the right picture, and the caudal fin was injured in the left picture. (B) Model of caudal fin injury: The bethanechol (1 μM, 10 μM) treated or untreated caudal fin was cut with a scalpel blade (white rectangles indicate statistical areas). (C) When the zebrafish caudal fin was not damaged, there was no difference in the number of neutrophils in the statistical area between bethanechol (1 μM, 10 μM) and the control group (the white rectangles indicate the statistical area). (D) The expression levels of tnf-α, il-1β, il-6 and il-8 in zebrafish treated with bethanechol (1 μM, 10 μM) were decreased compared with the LPS group (n = 30). (*P < 0.05,** P < 0.01, ***P < 0.001, ****P < 0.0001, one-way ANOVA analysis, LSD for port-hoc test). |
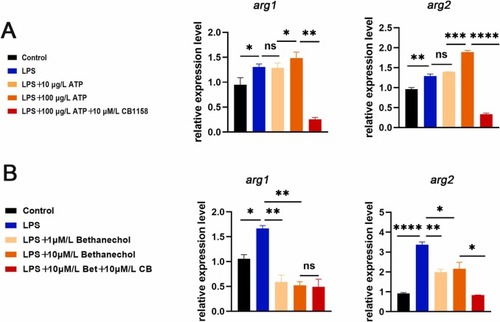
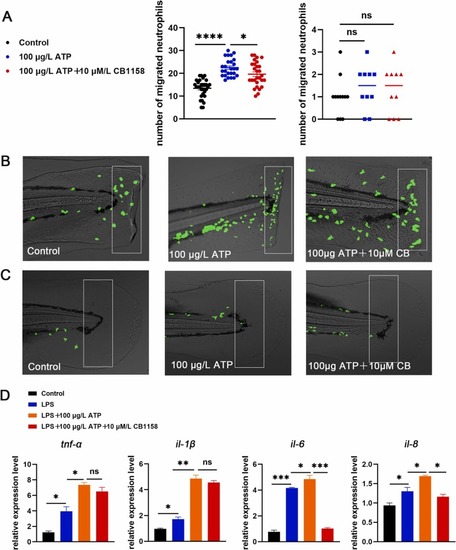
Fig. 6. Inhibition of arg1/2 down-regulated the increase in neutrophils migration and cytokines level caused by mAChR supression. (A) Neutrophils were photographed with a fluorescence microscope. The caudal fin was not injured in the right picture, and the caudal fin was injured in the left picture. Neutrophils migration increased after treatment with atropine (0.03 μM) in the statistical area, which could be reversed by CB-1158 (10 μM). (B) Model of caudal fin injury: atropine (0.03 μM), atropine (0.03 μM) and CB-1158 (10 μM) treated or untreated caudal fins of zebrafish were cut with a scalpel blade (white rectangles indicate statistical areas). (C) When the zebrafish caudal fin was not damaged, there was no difference in the number of neutrophils in the statistical area between atropine (0.03 μM), atropine (0.03 μM) and CB-1158 (10 μM) treatment and the control group (white rectangles indicate statistical area). (D) Treatment with atropine (0.03 μM), atropine (0.03 μM) and CB-1158 (10 μM) in LPS induced inflammation model to detect the expression levels of tnf-α, il-1β, il-6 and il-8 (n = 30). (*P < 0.05,** P < 0.01, ***P < 0.001, ****P < 0.0001, one-way ANOVA analysis, LSD for port-hoc test). EXPRESSION / LABELING:
PHENOTYPE:
|
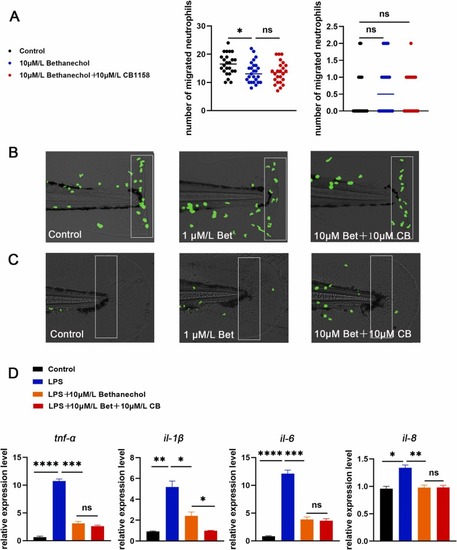
Fig. 7. Inhibition of arg1/2 could not further down-regulated the reduction in neutrophils migration and cytokines level caused by mAChR activation. (A) Neutrophils were photographed with a fluorescence microscope. The caudal fin was not injured in the right picture, and the caudal fin was injured in the left picture. Neutrophils migration was reduced after treatment with bethanechol (10 μM) in the statistical area, and treated with bethanechol (10 μM) and CB-1158 (10 μM), neutrophils migration in the statistical area was unchanged compared to the bethanechol (10 μM) treatment alone. (B) Model of caudal fin injury: caudal fins of zebrafish treated or untreated with bethanechol (10 μM), bethanechol (10 μM) and CB-1158 (10 μM) were cut with a scalpel blade (white rectangles indicate statistical areas). (C) When no damage to the caudal fin, bethanechol (10 μM) treatment, bethanechol (10 μM) and CB-1158 (10 μM) treatment showed no difference in the number of neutrophils in the statistical area (white rectangles indicate statistical area). (D) Treatment with bethanechol (10 μM), bethanechol (10 μM) and CB-1158 (10 μM) in LPS induced inflammation model to detect the expression levels of tnf-α, il-1β, il-6 and il-8 (n = 30). (*P < 0.05,** P < 0.01, ***P < 0.001, ****P < 0.0001, one-way ANOVA analysis, LSD for port-hoc test). EXPRESSION / LABELING:
PHENOTYPE:
|