
|
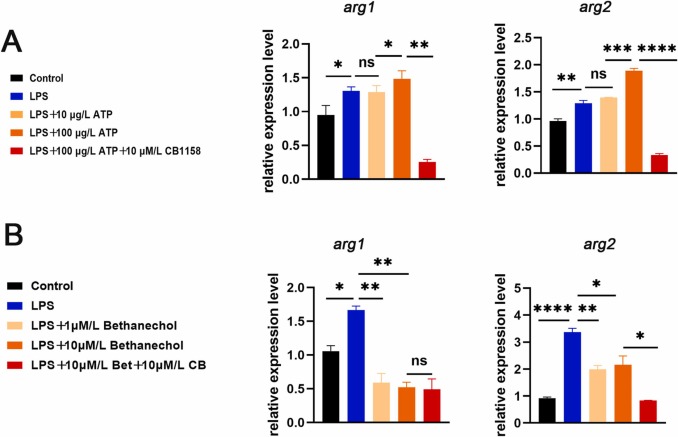
Fig. 5 Fig. 5. The mAChRs regulated the expressions of arg1 and arg2 in zebrafish. (A) In LPS induced inflammation model, zebrafish were treated with atropine (0.003 μM, 0.03 μM) to detect the levels of arg1 and arg2. Treated with atropine (0.03 μM), the expression of arg1 and arg2 was significantly increased,which could be inhibited by CB-1158. (B) In LPS induced inflammation model, zebrafish were treated with bethanechol (1 μM, 10 μM) to detect the expression of arg1 and arg2, and after treatment with bethanechol (10 μM), the arg2 level significantly decreased. (*P < 0.05,** P < 0.01, ***P < 0.001, ****P < 0.0001, one-way ANOVA analysis, LSD for port-hoc test).