
- Title
-
Relationship between Neuroprotective Effects and Structure of Procyanidins
- Authors
- Chen, J., Chen, Y., Zheng, Y., Zhao, J., Yu, H., Zhu, J.
- Source
- Full text @ Molecules
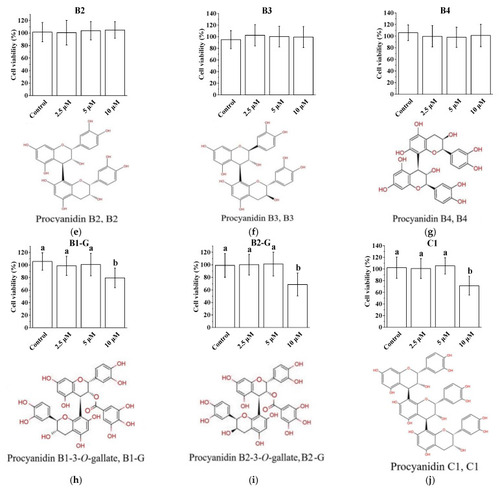
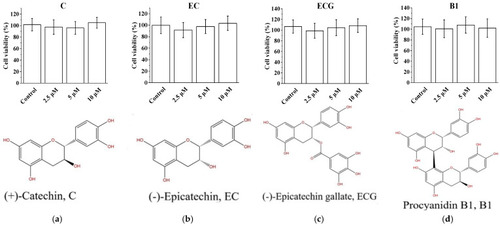
Cytotoxicity of different procyanidins in PC12 cells. (a) Survival of PC12 cells in the C treatment group; (b) Survival rate of PC12 cells in the EC treatment group; (c) Survival rate of PC12 cells in the ECG treatment group; (d) Survival rate of PC12 cells in the B1 treatment group; (e) Survival rate of PC12 cells in the B2 treatment group; (f) Survival rate of PC12 cells in the B3 treatment group; (g) Survival rate of PC12 cells in the B4 treatment group; (h) Survival rate of PC12 cells in the B1-G treatment group; (i) Survival rate of PC12 cells in the B2-G treatment group; (j) Survival rate of PC12 cells in the C1 treatment group. Data are expressed as the mean ± SD. All experiments were conducted six times. Values with different letters above each bar represent significant differences (p < 0.05, one-way ANOVA). PC12, rat pheochromocytoma cell line; EC, epicatechin; ECG, epicatechin gallate; B1, procyanidin B1; B2, procyanidin B2; B3, procyanidin B3; B4, procyanidin B4; B1-G, procyanidin B1-3-O-gallate; B2-G: procyanidin B2-3-O-gallate; C1: procyanidin C1; SD, standard deviation; ANOVA, one-way analysis of variance. |
Cytotoxicity of different procyanidins in PC12 cells. (a) Survival of PC12 cells in the C treatment group; (b) Survival rate of PC12 cells in the EC treatment group; (c) Survival rate of PC12 cells in the ECG treatment group; (d) Survival rate of PC12 cells in the B1 treatment group; (e) Survival rate of PC12 cells in the B2 treatment group; (f) Survival rate of PC12 cells in the B3 treatment group; (g) Survival rate of PC12 cells in the B4 treatment group; (h) Survival rate of PC12 cells in the B1-G treatment group; (i) Survival rate of PC12 cells in the B2-G treatment group; (j) Survival rate of PC12 cells in the C1 treatment group. Data are expressed as the mean ± SD. All experiments were conducted six times. Values with different letters above each bar represent significant differences (p < 0.05, one-way ANOVA). PC12, rat pheochromocytoma cell line; EC, epicatechin; ECG, epicatechin gallate; B1, procyanidin B1; B2, procyanidin B2; B3, procyanidin B3; B4, procyanidin B4; B1-G, procyanidin B1-3-O-gallate; B2-G: procyanidin B2-3-O-gallate; C1: procyanidin C1; SD, standard deviation; ANOVA, one-way analysis of variance. |
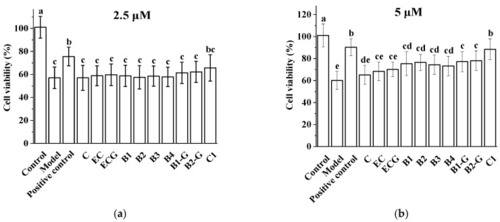
Effect of different procyanidins on the survival of PC12 cells induced by H2O2. (a) Effect of 2.5 μM procyanidins on the survival of PC12 cells induced by H2O2; (b) Effect of 5 μM procyanidins on the survival of PC12 cells induced by H2O2. Control, Blank control group; Model. H2O2 (200 μM); Positive control, NAC (20 μM) + H2O2 (200 μM); C, C + H2O2 (200 μM); EC, EC + H2O2 (200 μM); ECG, ECG + H2O2 (200 μM); B1, B1 + H2O2 (200 μM); B2, B2 + H2O2 (200 μM); B3, B3 + H2O2 (200 μM); B4, B4 + H2O2 (200 μM); B1-G, B1-G + H2O2 (200 μM); B2-G, B2-G + H2O2 (200 μM); C1, C1 + H2O2 (200 μM). Data are expressed as the mean ± SD. All experiments were conducted six times. Values with different letters above each bar represent significant differences (p < 0.05, one-way ANOVA). NAC, N-acetyl-l-cysteine. |
Effects of procyanidins with different structures on oxidative stress in PC12 cells treated with H2O2. ( |
Effects of procyanidins with different structures on oxidative stress in PC12 cells treated with H2O2. ( |
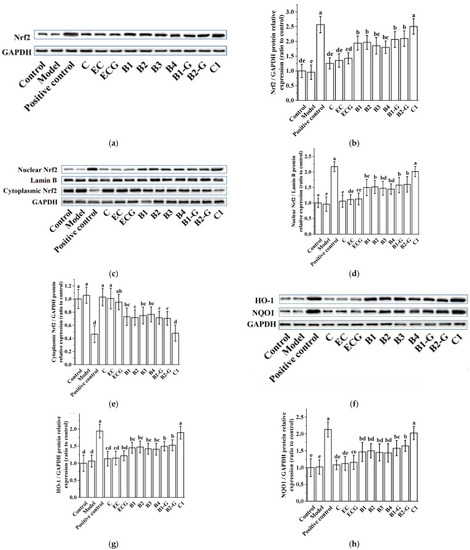
Effects of procyanidins with different structures on the Nrf2/ARE pathway in PC12 cells treated with H2O2. (a) Protein levels of Nrf2, as determined by Western blotting; (b) Relative Nrf2/GAPDH protein expression (ratio to control); (c) Protein expression levels of nuclear Nrf2 and cytoplasmic Nrf2, as determined by Western blotting; (d) Relative nuclear Nrf2/Lamin B protein expression (ratio to control); (e) Relative cytoplasmic Nrf2/GAPDH protein expression (ratio to control); (f) Protein levels of HO-1 and NQO1, as determined by Western blotting; (g) Relative HO-1/GAPDH protein expression (ratio to control); (h) Relative NQO1/GAPDH protein expression (ratio to control). Data are expressed as the mean ± SD. Control, Blank control group; Model, H2O2 (200 μM); Positive control, NAC (20 μM) + H2O2 (200 μM); C, C (5 μM) + H2O2 (200 μM); EC, EC (5 μM) + H2O2 (200 μM); ECG, ECG (5 μM) + H2O2 (200 μM); B1, B1 (5 μM) + H2O2 (200 μM); B2, B2 (5 μM) + H2O2 (200 μM); B3, B3 (5 μM) + H2O2 (200 μM); B4, B4 (5 μM) + H2O2 (200 μM); B1-G, B1-G (5 μM) + H2O2 (200 μM); B2-G, B2-G (5 μM) + H2O2 (200 μM); C1, C1 (5 μM) + H2O2 (200 μM). All experiments were conducted three times. Values with different letters are significantly different (p < 0.05, one-way ANOVA). Nrf2, nuclear factor-erythroid 2-related factor 2; ARE, antioxidant response element; HO-1, heme oxygenase 1; NQO1, NAD(P)H: quinone oxidoreductase 1. |
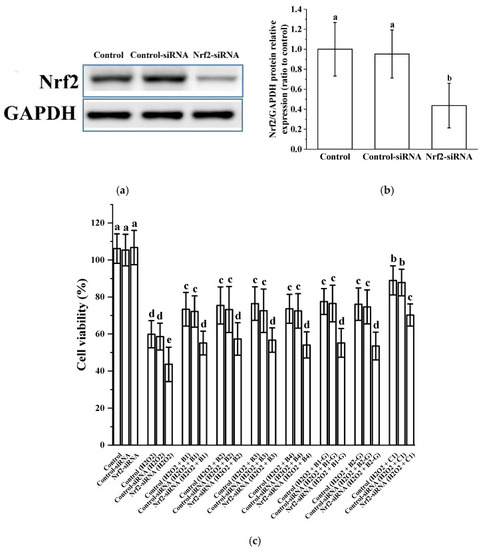
Verification of the role of Nrf2 in the protective effect of procyanidins with different structures. ( |
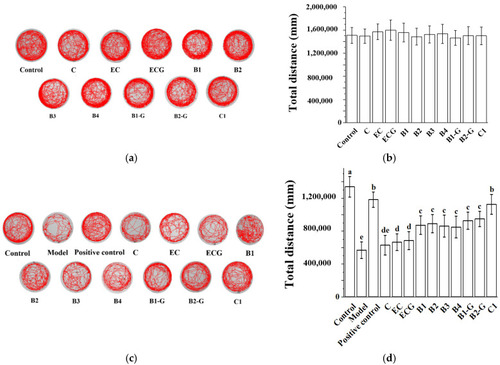
Effects of procyanidins with different structures on exercise ability in zebrafish treated with H2O2. (a) Swimming traces of zebrafish in each group; (b) Average total distance of zebrafish in each group; (c) Swimming traces of zebrafish in each group; (d) Average total distance of zebrafish in each group. Data are expressed as the mean ± SD. Control, Blank control group; Model, H2O2 (300 μM); Positive control, NAC (30 μM) + H2O2 (300 μM); C, C (25 μM) + H2O2 (300 μM); EC, EC (25 μM) + H2O2 (300 μM); ECG, ECG (25 μM) + H2O2 (300 μM); B1, B1 (25 μM) + H2O2 (300 μM); B2, B2 (25 μM) + H2O2 (300 μM); B3, B3 (25 μM) + H2O2 (300 μM); B4, B4 (25 μM) + H2O2 (300 μM); B1-G, B1-G (25 μM) + H2O2 (300 μM); B2-G, B2-G (25 μM) + H2O2 (300 μM); C1, C1 (25 μM) + H2O2 (300 μM). All experiments were conducted three times. Values with different letters are significantly different (p < 0.05, one-way ANOVA). |
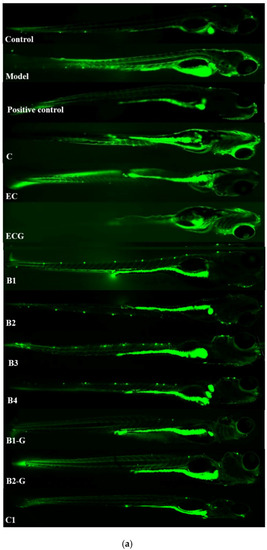
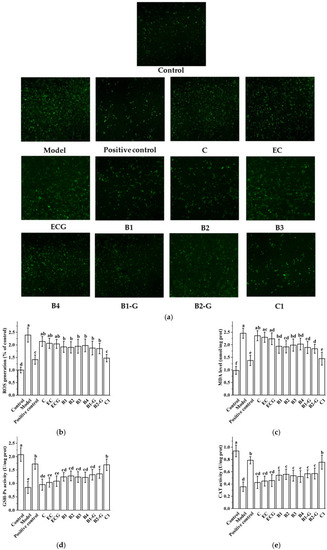
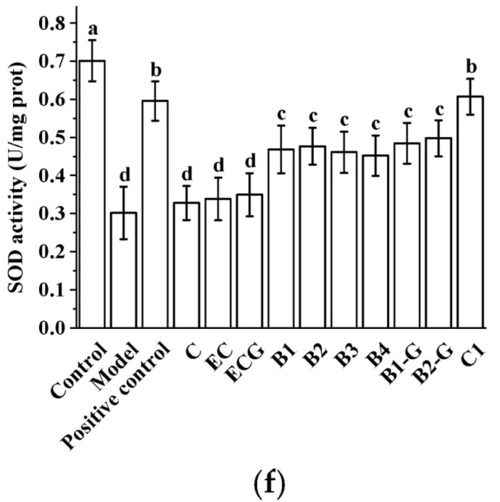
Effects of procyanidins with different structures on oxidative stress in zebrafish treated with H2O2. (a) Representative fluorescence photomicrographs of zebrafish; (b) ROS levels; (c) MDA levels; (d) GSH-Px activity; (e) CAT activity; (f) SOD activity. Data are expressed as the mean ± SD. Control, Blank control group; Model, H2O2 (300 μM); Positive control, NAC (30 μM) + H2O2 (300 μM); C, C (25 μM) + H2O2 (300 μM); EC, EC (25 μM) + H2O2 (300 μM); ECG, ECG (25 μM) + H2O2 (300 μM); B1, B1 (25 μM) + H2O2 (300 μM); B2, B2 (25 μM) + H2O2 (300 μM); B3, B3 (25 μM) + H2O2 (300 μM); B4, B4 (25 μM) + H2O2 (300 μM); B1-G, B1-G (25 μM) + H2O2 (300 μM); B2-G, B2-G (25 μM) + H2O2 (300 μM); C1, C1 (25 μM) + H2O2 (300 μM). All experiments were conducted three times. Values with different letters are significantly different (p < 0.05, one-way ANOVA). |
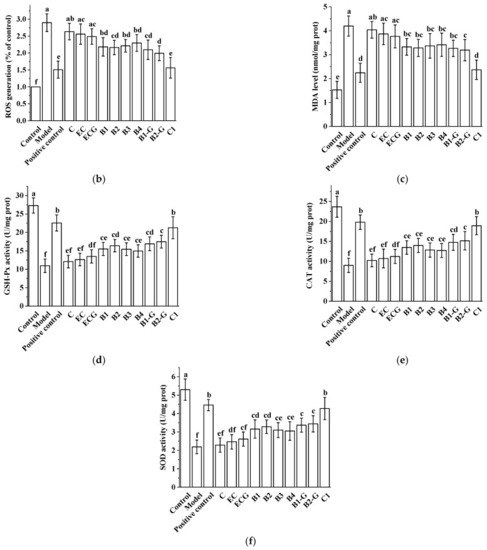
Effects of procyanidins with different structures on oxidative stress in zebrafish treated with H2O2. (a) Representative fluorescence photomicrographs of zebrafish; (b) ROS levels; (c) MDA levels; (d) GSH-Px activity; (e) CAT activity; (f) SOD activity. Data are expressed as the mean ± SD. Control, Blank control group; Model, H2O2 (300 μM); Positive control, NAC (30 μM) + H2O2 (300 μM); C, C (25 μM) + H2O2 (300 μM); EC, EC (25 μM) + H2O2 (300 μM); ECG, ECG (25 μM) + H2O2 (300 μM); B1, B1 (25 μM) + H2O2 (300 μM); B2, B2 (25 μM) + H2O2 (300 μM); B3, B3 (25 μM) + H2O2 (300 μM); B4, B4 (25 μM) + H2O2 (300 μM); B1-G, B1-G (25 μM) + H2O2 (300 μM); B2-G, B2-G (25 μM) + H2O2 (300 μM); C1, C1 (25 μM) + H2O2 (300 μM). All experiments were conducted three times. Values with different letters are significantly different (p < 0.05, one-way ANOVA). |
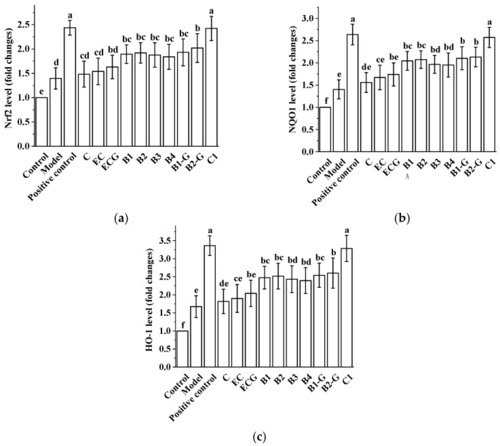
Effects of procyanidins with different structures on the Nrf2/ARE pathway in zebrafish treated with H2O2. (a) Nrf2 levels; (b) NQO1 levels; (c) HO-1 levels. Data are expressed as the mean ± SD. Control, Blank control group; Model, H2O2 (300 μM); Positive control, NAC (30 μM) + H2O2 (300 μM); C, C (25 μM) + H2O2 (300 μM); EC, EC (25 μM) + H2O2 (300 μM); ECG, ECG (25 μM) + H2O2 (300 μM); B1, B1 (25 μM) + H2O2 (300 μM); B2, B2 (25 μM) + H2O2 (300 μM); B3, B3 (25 μM) + H2O2 (300 μM); B4, B4 (25 μM) + H2O2 (300 μM); B1-G, B1-G (25 μM) + H2O2 (300 μM); B2-G, B2-G (25 μM) + H2O2 (300 μM); C1, C1 (25 μM) + H2O2 (300 μM). All experiments were conducted three times. Values with different letters are significantly different (p < 0.05, one-way ANOVA). |