
|
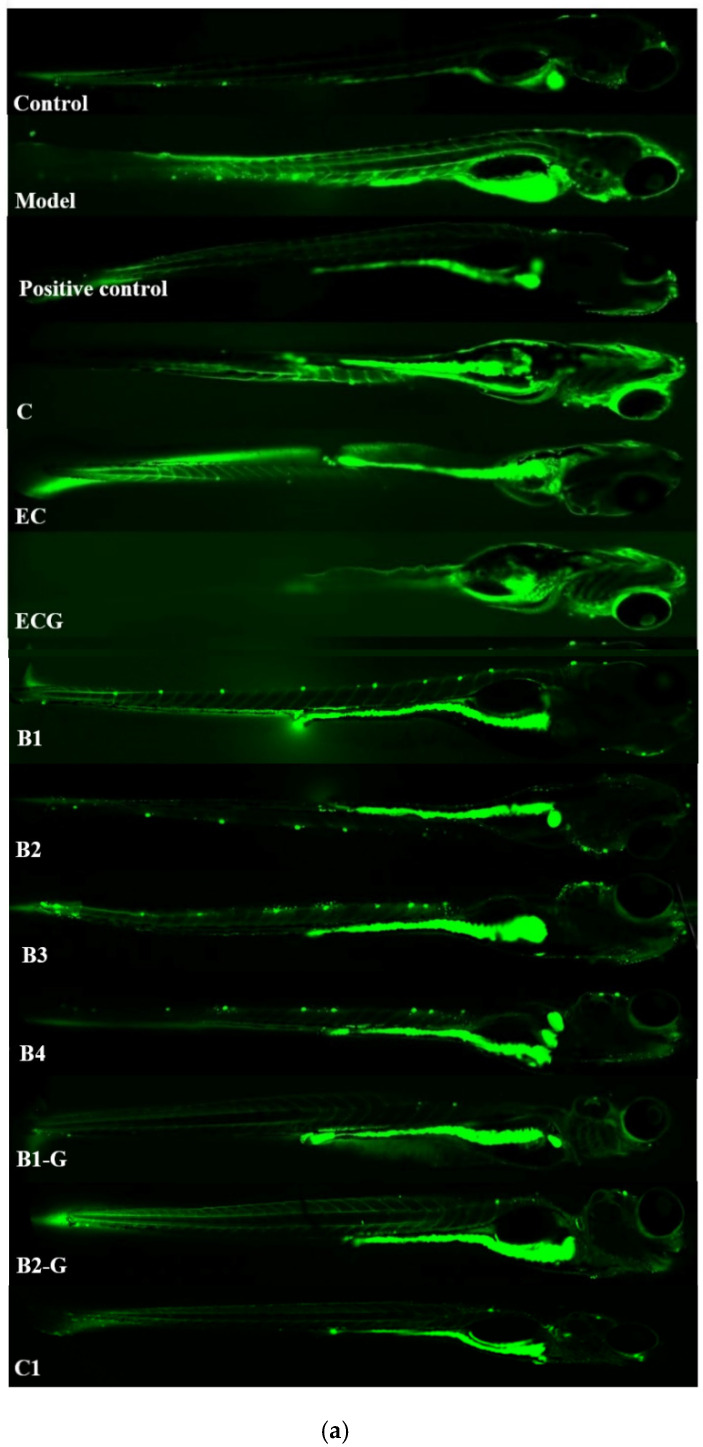
Figure 7 Effects of procyanidins with different structures on oxidative stress in zebrafish treated with H2O2. (a) Representative fluorescence photomicrographs of zebrafish; (b) ROS levels; (c) MDA levels; (d) GSH-Px activity; (e) CAT activity; (f) SOD activity. Data are expressed as the mean ± SD. Control, Blank control group; Model, H2O2 (300 μM); Positive control, NAC (30 μM) + H2O2 (300 μM); C, C (25 μM) + H2O2 (300 μM); EC, EC (25 μM) + H2O2 (300 μM); ECG, ECG (25 μM) + H2O2 (300 μM); B1, B1 (25 μM) + H2O2 (300 μM); B2, B2 (25 μM) + H2O2 (300 μM); B3, B3 (25 μM) + H2O2 (300 μM); B4, B4 (25 μM) + H2O2 (300 μM); B1-G, B1-G (25 μM) + H2O2 (300 μM); B2-G, B2-G (25 μM) + H2O2 (300 μM); C1, C1 (25 μM) + H2O2 (300 μM). All experiments were conducted three times. Values with different letters are significantly different (p < 0.05, one-way ANOVA).