
Figure 2
- ID
- ZDB-FIG-220416-12
- Publication
- Chen et al., 2022 - Relationship between Neuroprotective Effects and Structure of Procyanidins
- Other Figures
- All Figure Page
- Back to All Figure Page
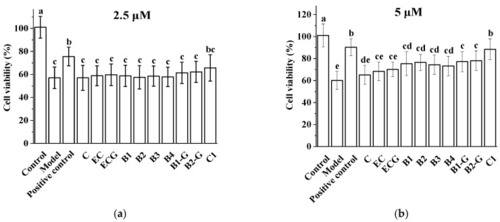
Effect of different procyanidins on the survival of PC12 cells induced by H2O2. (a) Effect of 2.5 μM procyanidins on the survival of PC12 cells induced by H2O2; (b) Effect of 5 μM procyanidins on the survival of PC12 cells induced by H2O2. Control, Blank control group; Model. H2O2 (200 μM); Positive control, NAC (20 μM) + H2O2 (200 μM); C, C + H2O2 (200 μM); EC, EC + H2O2 (200 μM); ECG, ECG + H2O2 (200 μM); B1, B1 + H2O2 (200 μM); B2, B2 + H2O2 (200 μM); B3, B3 + H2O2 (200 μM); B4, B4 + H2O2 (200 μM); B1-G, B1-G + H2O2 (200 μM); B2-G, B2-G + H2O2 (200 μM); C1, C1 + H2O2 (200 μM). Data are expressed as the mean ± SD. All experiments were conducted six times. Values with different letters above each bar represent significant differences (p < 0.05, one-way ANOVA). NAC, N-acetyl-l-cysteine. |