FIGURE

Figure 3 Cont.

ID
ZDB-FIG-220416-39
Publication
Chen et al., 2022 - Relationship between Neuroprotective Effects and Structure of Procyanidins
Other Figures
All Figure Page
Back to All Figure Page
Figure 3 Cont.

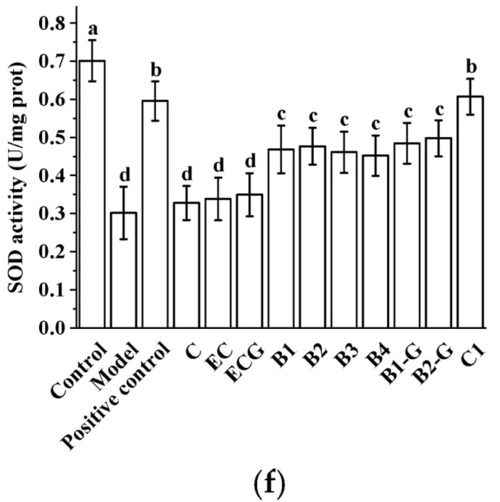
Effects of procyanidins with different structures on oxidative stress in PC12 cells treated with H2O2. (a) Representative fluorescence photomicrographs of PC12 cells; (b) ROS levels; (c) MDA levels; (d) GSH-Px activity; (e) CAT activity; (f) SOD activity. Data are expressed as the mean ± SD. Control, Blank control group; Model, H2O2 (200 μM); Positive control, NAC (20 μM) + H2O2 (200 μM); C, C (5 μM) + H2O2 (200 μM); EC, EC (5 μM) + H2O2 (200 μM); ECG, ECG (5 μM) + H2O2 (200 μM); B1, B1 (5 μM) + H2O2 (200 μM); B2, B2 (5 μM) + H2O2 (200 μM); B3, B3 (5 μM) + H2O2 (200 μM); B4, B4 (5 μM) + H2O2 (200 μM); B1-G, B1-G (5 μM) + H2O2 (200 μM); B2-G, B2-G (5 μM) + H2O2 (200 μM); C1, C1 (5 μM) + H2O2 (200 μM). All experiments were conducted three times. Values with different letters are significantly different (p < 0.05, one-way ANOVA). ROS, reactive oxygen species; MDA, malondialdehyde; GSH-Px, glutathione peroxidase; CAT, catalase; SOD, superoxide dismutase.

Expression Data

Expression Detail
Antibody Labeling
Phenotype Data

Phenotype Detail
Acknowledgments
This image is the copyrighted work of the attributed author or publisher, and ZFIN has permission only to display this image to its users. Additional permissions should be obtained from the applicable author or publisher of the image. Full text @ Molecules