
|
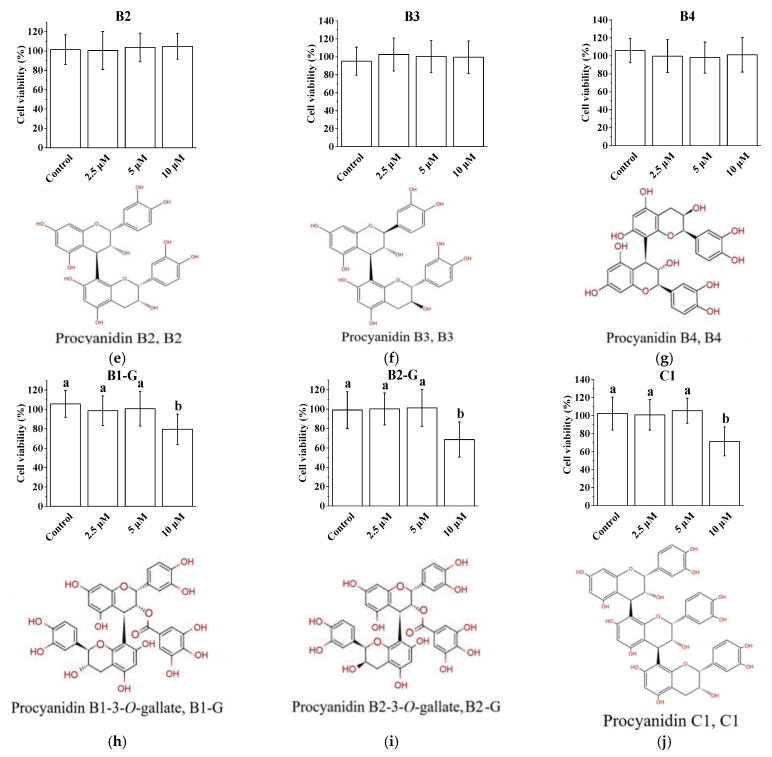
Figure 1 Cytotoxicity of different procyanidins in PC12 cells. (a) Survival of PC12 cells in the C treatment group; (b) Survival rate of PC12 cells in the EC treatment group; (c) Survival rate of PC12 cells in the ECG treatment group; (d) Survival rate of PC12 cells in the B1 treatment group; (e) Survival rate of PC12 cells in the B2 treatment group; (f) Survival rate of PC12 cells in the B3 treatment group; (g) Survival rate of PC12 cells in the B4 treatment group; (h) Survival rate of PC12 cells in the B1-G treatment group; (i) Survival rate of PC12 cells in the B2-G treatment group; (j) Survival rate of PC12 cells in the C1 treatment group. Data are expressed as the mean ± SD. All experiments were conducted six times. Values with different letters above each bar represent significant differences (p < 0.05, one-way ANOVA). PC12, rat pheochromocytoma cell line; EC, epicatechin; ECG, epicatechin gallate; B1, procyanidin B1; B2, procyanidin B2; B3, procyanidin B3; B4, procyanidin B4; B1-G, procyanidin B1-3-O-gallate; B2-G: procyanidin B2-3-O-gallate; C1: procyanidin C1; SD, standard deviation; ANOVA, one-way analysis of variance.