
Figure 4
- ID
- ZDB-FIG-220416-40
- Publication
- Chen et al., 2022 - Relationship between Neuroprotective Effects and Structure of Procyanidins
- Other Figures
- All Figure Page
- Back to All Figure Page
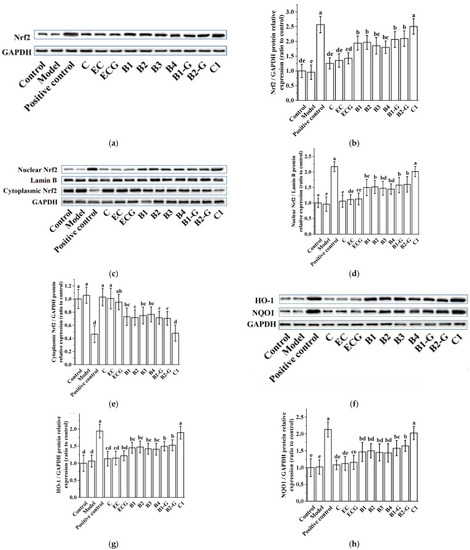
Effects of procyanidins with different structures on the Nrf2/ARE pathway in PC12 cells treated with H2O2. (a) Protein levels of Nrf2, as determined by Western blotting; (b) Relative Nrf2/GAPDH protein expression (ratio to control); (c) Protein expression levels of nuclear Nrf2 and cytoplasmic Nrf2, as determined by Western blotting; (d) Relative nuclear Nrf2/Lamin B protein expression (ratio to control); (e) Relative cytoplasmic Nrf2/GAPDH protein expression (ratio to control); (f) Protein levels of HO-1 and NQO1, as determined by Western blotting; (g) Relative HO-1/GAPDH protein expression (ratio to control); (h) Relative NQO1/GAPDH protein expression (ratio to control). Data are expressed as the mean ± SD. Control, Blank control group; Model, H2O2 (200 μM); Positive control, NAC (20 μM) + H2O2 (200 μM); C, C (5 μM) + H2O2 (200 μM); EC, EC (5 μM) + H2O2 (200 μM); ECG, ECG (5 μM) + H2O2 (200 μM); B1, B1 (5 μM) + H2O2 (200 μM); B2, B2 (5 μM) + H2O2 (200 μM); B3, B3 (5 μM) + H2O2 (200 μM); B4, B4 (5 μM) + H2O2 (200 μM); B1-G, B1-G (5 μM) + H2O2 (200 μM); B2-G, B2-G (5 μM) + H2O2 (200 μM); C1, C1 (5 μM) + H2O2 (200 μM). All experiments were conducted three times. Values with different letters are significantly different (p < 0.05, one-way ANOVA). Nrf2, nuclear factor-erythroid 2-related factor 2; ARE, antioxidant response element; HO-1, heme oxygenase 1; NQO1, NAD(P)H: quinone oxidoreductase 1. |