
- Title
-
Inner nuclear membrane protein TMEM201 maintains endothelial cell migration and angiogenesis by interacting with the LINC complex
- Authors
- Zhang, Y., Kong, Y., Guo, H., Liu, Y., Zang, Y., Li, J.
- Source
- Full text @ J. Mol. Cell Biol.
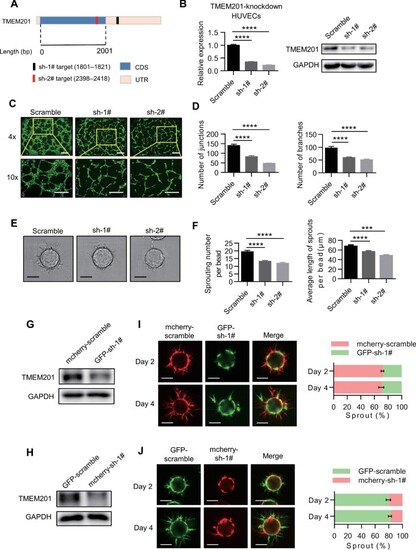
Loss of TMEM201 represses EC tube formation and sprouting capacity. (A) The strategy of TMEM201 knockdown. Schematic illustration of TMEM201 mRNA with untranslated regions (UTRs) and coding DNA sequences (CDSs). The positions of the sh-1# and sh-2# targets are indicated. (B) RT–qPCR and western blotting analyses show the relative TMEM201 levels in HUVECs expressing control (scramble) or TMEM201 knockdown (sh-1# and sh-2#) shRNA. (C and D) Knockdown of TMEM201 decreased HUVEC tube formation capacity. (C) Representative fluorescent images of the tube formation assay. Tubes were visualized with calcein AM (green), and images were captured at 4× and 10× magnification. Scale bar, 200 μm. (D) Quantitative analyses of tube formation. At least six random fields were analyzed for each group. The number of junctions and branches was quantified with ImageJ. (E) Representative images of sprouts at culture Day 4 in control or TMEM201-knockdown EA.hy926 cells. Scale bar, 100 μm. (F) Quantification analyses of sprouting. The sprouting number per bead and the average length of sprouts per bead were quantified. (G) Western blotting analysis shows TMEM201 levels in EA.hy926 cells expressing mCherry-scramble or GFP-sh-1#. (H) Western blotting analysis shows TMEM201 levels in EA.hy926 cells expressing GFP-scramble or mCherry-sh-1#. (I and J) Competitive sprouting assay with a 1:1 mixture of differentially labelled EA.hy926 cells as indicated. Representative images and quantification of differentially labelled sprouts in each group at culture Day 2 and Day 4 are shown. Scale bar, 100 μm. Data are presented as mean ± SEM (error bars). Statistical significance was determined by one-way ANOVA (***P < 0.001, ****P < 0.0001). |
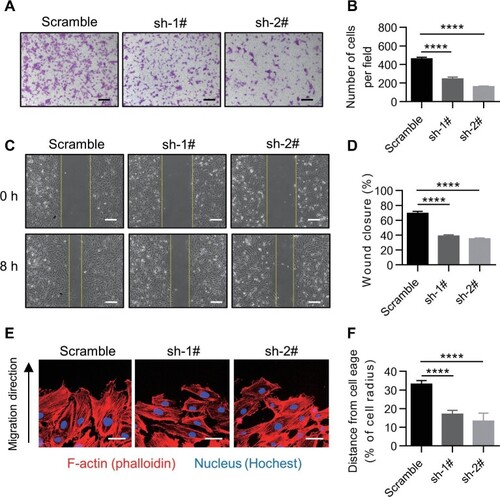
Knockdown of TMEM201 impairs EC migration. (A and B) The effect of TMEM201 silencing in HUVECs was examined using a transwell assay. (A) Representative images of the transwell assay are shown. Scale bar, 200 μm. (B) The numbers of migrating cells per field were counted. (C and D) The effect of TMEM201 silencing in HUVECs was examined using a wound healing assay. (C) Representative images at 0 and 8 h after scratching are shown. Yellow dotted lines indicate the migration leading edges. Scale bar, 100 μm. (D) The percentage of wound closure was determined at 8 h. (E) Representative images of HUVECs at the leading edge in the wound healing assay. Merged images of F-actin (red) and nuclei (blue) are shown. Scale bar, 40 μm. (F) Quantitative analysis of nuclear position. The distances away from the leading edge were calculated. Data are presented as mean ± SEM (error bars). Statistical significance was determined by one-way ANOVA (****P < 0.0001). |
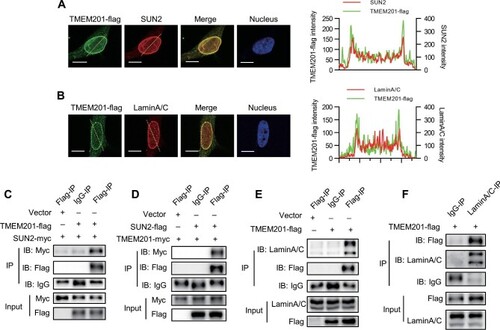
TMEM201 interacts with LINC complex components SUN2 and LaminA/C in EC. (A and B) TMEM201-flag was detected by immunofluorescence in HUVECs with anti-Flag antibody and costained for SUN2 (A) or LaminA/C (B). The dotted yellow line was examined for the colocalization analysis, shown on the right. The X-axis shows the relative position of the dotted yellow line. The Y-axis shows the intensity signals in the green and red channels. Scale bar, 10 μm. (C) CoIP assay and western blotting analysis show that TMEM201-flag coimmunoprecipitated with SUN2-myc. EA.hy926 cells were transfected with vector or TMEM201-flag together with SUN2-myc. Cell lysates were immunoprecipitated with anti-Flag or control IgG and immunoblotted with antibodies against Flag and Myc. (D) CoIP assay and western blotting analysis show that SUN2-flag coimmunoprecipitated with TMEM201-myc. EA.hy926 cells were transfected with vector or SUN2-flag together with TMEM201-myc. Cell lysates were immunoprecipitated with anti-Flag or control IgG and immunoblotted with antibodies against Flag and Myc. (E) CoIP assay and western blotting analysis show that TMEM201-flag coimmunoprecipitated with endogenous LaminA/C. EA.hy926 cells were transfected with vector or TMEM201-flag. Cell lysates were immunoprecipitated with anti-Flag or control IgG and immunoblotted with antibodies against Flag and LaminA/C. (F) CoIP assay and western blotting analysis show that endogenous LaminA/C coimmunoprecipitated with TMEM201-flag. EA.hy926 cells were transfected with TMEM201-flag. Cell lysates were immunoprecipitated with anti-LaminA/C or control IgG and immunoblotted with antibodies against Flag and LaminA/C. |
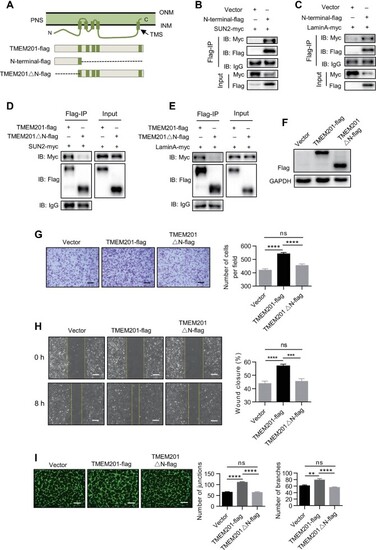
The N-terminus of TMEM201 interacts with the LINC complex and is required for EC migration. (A) Schematic diagram of Flag-tagged full-length TMEM201 and several truncations for subsequent experiments. (B and C) HEK-293T cells were transfected with vector or TMEM201-N-terminal-flag, together with SUN2-myc (B) or LaminA-myc (C). Cell lysates were immunoprecipitated with anti-Flag and immunoblotted with antibodies against Flag and Myc. (D and E) HEK-293T cells were transfected with full-length TMEM201-flag or TMEM201△N-flag, together with SUN2-myc (D) or LaminA-myc (E). Cell lysates were immunoprecipitated with anti-Flag and immunoblotted with antibodies against Flag and Myc. (F) Western blotting analyses show the relative TMEM201 expression in TMEM201-flag- or TMEM201△N-flag-expressing HUVECs. (G–I) The effects of full-length TMEM201-flag and TMEM201△N-flag in HUVECs were examined using transwell, wound healing, and tube formation assays. (G) Representative images of the transwell assay are shown. Scale bar, 200 μm. The numbers of migrating cells per field were counted. (H) Representative images at 0 and 8 h after scratching are shown. Yellow dotted lines indicate the migration leading edges. The percentage of wound closure was determined at 8 h. Scale bar, 100 μm. (I) Representative fluorescent images and quantitative analyses of the tube formation assay. Tubes were visualized with calcein AM (Green). Scale bar, 200 μm. Data are presented as mean ± SEM (error bars). Statistical significance was determined by one-way ANOVA (**P < 0.01, ***P < 0.001, ****P < 0.0001, and ns = no significance). |
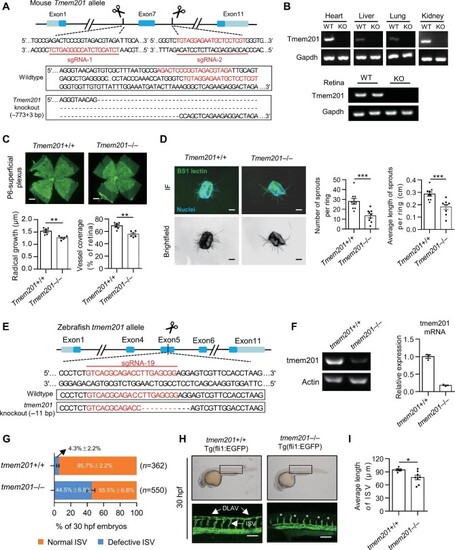
Defective angiogenesis in Tmem201-knockout mice and tmem201-knockout zebrafish. (A) Schematic diagram of CRISPR/Cas9-mediated knockout of the mouse Tmem201 allele. The sequences of sgRNAs and corresponding deletion sites are shown. (B) RT–PCR for Tmem201 and Gapdh performed on mRNA extracted from tissues of the indicated mice. (C) Representative images of whole-mounted retinas from Tmem201+/+ and Tmem201–/– mice at P6. Retinal vessels were stained with Isolectin GS-IB4 (green). Scale bar, 500 μm. Reduced extension of the superficial plexus was quantitated in the retina of Tmem201+/+ and Tmem201–/– mice (n = 6 for each group). (D) Aortic ring assays of Tmem201+/+ and Tmem201–/– mice. EC sprouts were stained with BSI lectin (green). Scale bar, 200 μm. The number of sprouts and the average length of sprouts emerging from the aortic ring were determined. (E) Schematic diagram of CRISPR/Cas9-mediated knockout of the zebrafish tmem201 allele. The sequence of sgRNA and its corresponding deletion sites are shown. (F) RT–PCR and qPCR for tmem201 and actin performed on mRNA extracted from the tissue of the indicated zebrafish. (G) The percentages of 30-hpf tmem201+/+ and tmem201–/– embryos with normal or defective ISV. Four independent trials were performed, and the numbers of embryos are shown. (H) Representative images of 30-hpf embryos. In tmem201+/+ embryos, ISV fully extended and started to form DLAV. In tmem201–/– embryos, ISV did not extend completely, and DLAV was absent. ISV and DLAV are indicated with white arrows. White asterisks represent defective ISV. Scale bar, 500 μm. (I) Quantitative analyses of embryo ISV development in H. The average length of ISV was calculated for each group (n = 5 for tmem201+/+ and n = 8 for tmem201–/–). Data are presented as mean ± SEM (error bars). Statistical significance was determined by Student's t-test (*P < 0.05, **P < 0.01, ***P < 0.001). |