
|
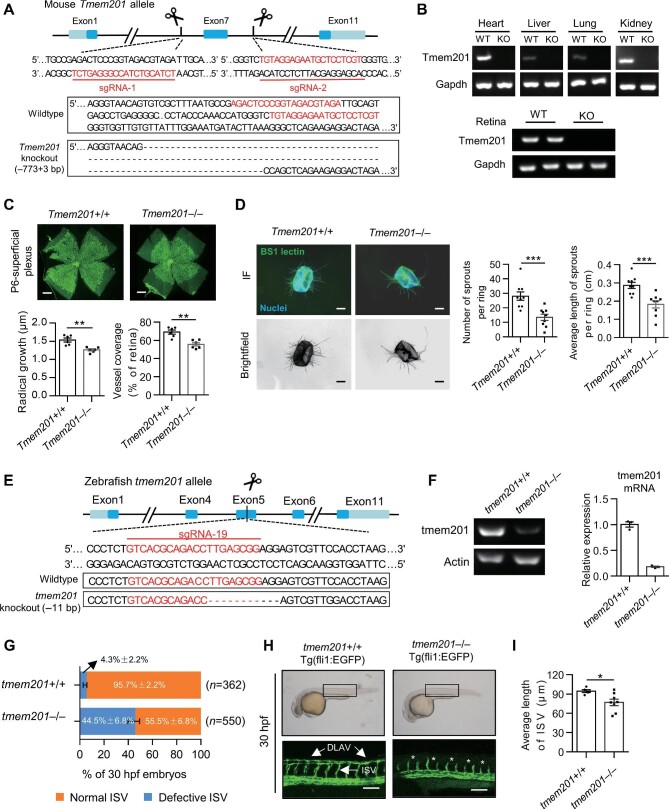
Fig. 5
Defective angiogenesis in Tmem201-knockout mice and tmem201-knockout zebrafish. (A) Schematic diagram of CRISPR/Cas9-mediated knockout of the mouse Tmem201 allele. The sequences of sgRNAs and corresponding deletion sites are shown. (B) RT–PCR for Tmem201 and Gapdh performed on mRNA extracted from tissues of the indicated mice. (C) Representative images of whole-mounted retinas from Tmem201+/+ and Tmem201–/– mice at P6. Retinal vessels were stained with Isolectin GS-IB4 (green). Scale bar, 500 μm. Reduced extension of the superficial plexus was quantitated in the retina of Tmem201+/+ and Tmem201–/– mice (n = 6 for each group). (D) Aortic ring assays of Tmem201+/+ and Tmem201–/– mice. EC sprouts were stained with BSI lectin (green). Scale bar, 200 μm. The number of sprouts and the average length of sprouts emerging from the aortic ring were determined. (E) Schematic diagram of CRISPR/Cas9-mediated knockout of the zebrafish tmem201 allele. The sequence of sgRNA and its corresponding deletion sites are shown. (F) RT–PCR and qPCR for tmem201 and actin performed on mRNA extracted from the tissue of the indicated zebrafish. (G) The percentages of 30-hpf tmem201+/+ and tmem201–/– embryos with normal or defective ISV. Four independent trials were performed, and the numbers of embryos are shown. (H) Representative images of 30-hpf embryos. In tmem201+/+ embryos, ISV fully extended and started to form DLAV. In tmem201–/– embryos, ISV did not extend completely, and DLAV was absent. ISV and DLAV are indicated with white arrows. White asterisks represent defective ISV. Scale bar, 500 μm. (I) Quantitative analyses of embryo ISV development in H. The average length of ISV was calculated for each group (n = 5 for tmem201+/+ and n = 8 for tmem201–/–). Data are presented as mean ± SEM (error bars). Statistical significance was determined by Student's t-test (*P < 0.05, **P < 0.01, ***P < 0.001).