
|
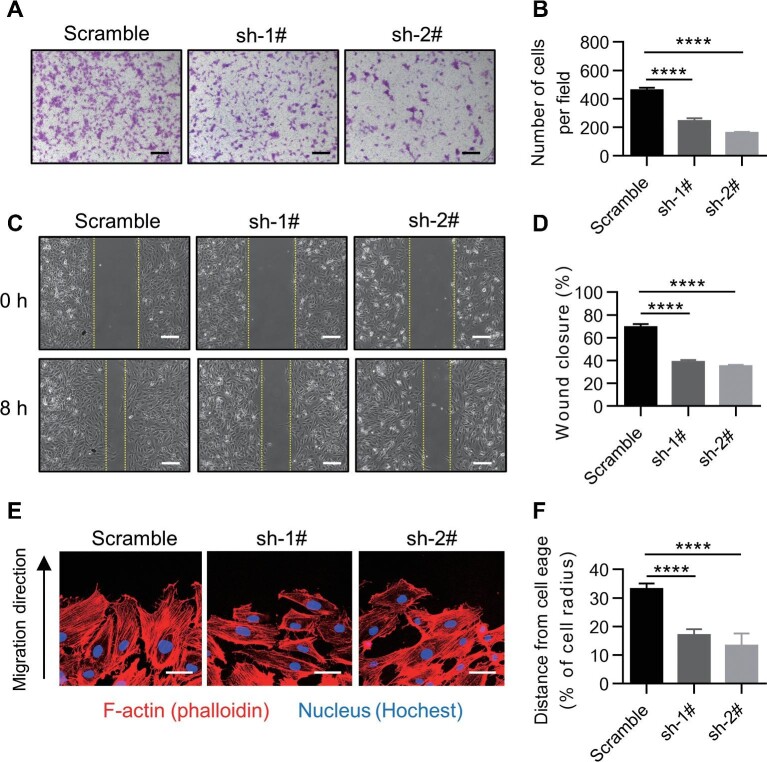
Fig. 2
Knockdown of TMEM201 impairs EC migration. (A and B) The effect of TMEM201 silencing in HUVECs was examined using a transwell assay. (A) Representative images of the transwell assay are shown. Scale bar, 200 μm. (B) The numbers of migrating cells per field were counted. (C and D) The effect of TMEM201 silencing in HUVECs was examined using a wound healing assay. (C) Representative images at 0 and 8 h after scratching are shown. Yellow dotted lines indicate the migration leading edges. Scale bar, 100 μm. (D) The percentage of wound closure was determined at 8 h. (E) Representative images of HUVECs at the leading edge in the wound healing assay. Merged images of F-actin (red) and nuclei (blue) are shown. Scale bar, 40 μm. (F) Quantitative analysis of nuclear position. The distances away from the leading edge were calculated. Data are presented as mean ± SEM (error bars). Statistical significance was determined by one-way ANOVA (****P < 0.0001).