
Fig. 1
- ID
- ZDB-FIG-220804-1
- Publication
- Zhang et al., 2022 - Inner nuclear membrane protein TMEM201 maintains endothelial cell migration and angiogenesis by interacting with the LINC complex
- Other Figures
- All Figure Page
- Back to All Figure Page
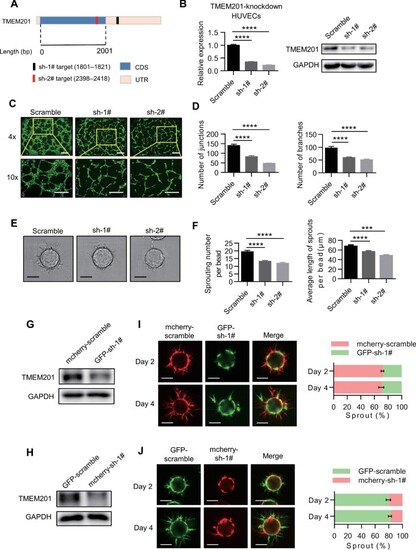
Loss of TMEM201 represses EC tube formation and sprouting capacity. (A) The strategy of TMEM201 knockdown. Schematic illustration of TMEM201 mRNA with untranslated regions (UTRs) and coding DNA sequences (CDSs). The positions of the sh-1# and sh-2# targets are indicated. (B) RT–qPCR and western blotting analyses show the relative TMEM201 levels in HUVECs expressing control (scramble) or TMEM201 knockdown (sh-1# and sh-2#) shRNA. (C and D) Knockdown of TMEM201 decreased HUVEC tube formation capacity. (C) Representative fluorescent images of the tube formation assay. Tubes were visualized with calcein AM (green), and images were captured at 4× and 10× magnification. Scale bar, 200 μm. (D) Quantitative analyses of tube formation. At least six random fields were analyzed for each group. The number of junctions and branches was quantified with ImageJ. (E) Representative images of sprouts at culture Day 4 in control or TMEM201-knockdown EA.hy926 cells. Scale bar, 100 μm. (F) Quantification analyses of sprouting. The sprouting number per bead and the average length of sprouts per bead were quantified. (G) Western blotting analysis shows TMEM201 levels in EA.hy926 cells expressing mCherry-scramble or GFP-sh-1#. (H) Western blotting analysis shows TMEM201 levels in EA.hy926 cells expressing GFP-scramble or mCherry-sh-1#. (I and J) Competitive sprouting assay with a 1:1 mixture of differentially labelled EA.hy926 cells as indicated. Representative images and quantification of differentially labelled sprouts in each group at culture Day 2 and Day 4 are shown. Scale bar, 100 μm. Data are presented as mean ± SEM (error bars). Statistical significance was determined by one-way ANOVA (***P < 0.001, ****P < 0.0001). |