FIGURE SUMMARY
Title

Multiple asters organize the yolk microtubule network during dclk2-GFP zebrafish epiboly

Authors
Marsal, M., Bernardello, M., Gualda, E.J., Loza-Alvarez, P.
Source
Full text @ Sci. Rep.

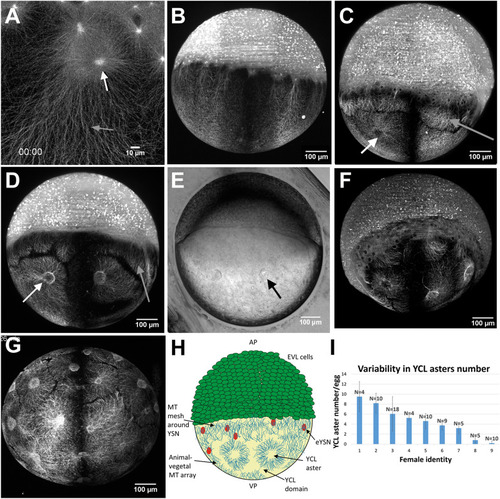
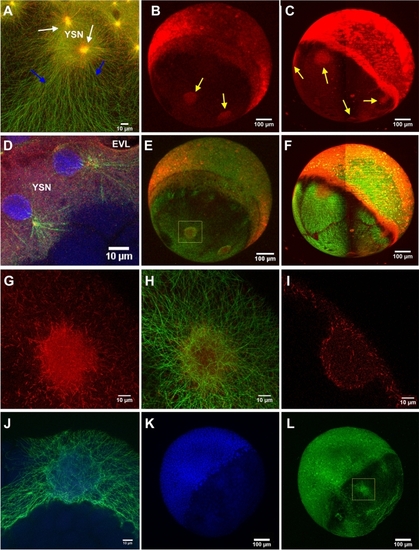
The variable presence of YCL asters in the yolk MT network of dclk2-GFP transgenic zebrafish embryos. (A) CLSM zoom into the YSL shows meshed interconnected MT with apparent spindles during mitosis of e-YSN (white arrow) and the AV parallel YCL MT arrays, emanating from MTOCs associated to the most vegetal e-YSN (grey arrow). (BF) Lateral views of transgenic embryos, with the animal pole at the top and the vegetal pole at the bottom. (B) At sphere stage, parallel MT arrays emerge from the YSL, covering the YCL. At the animal pole, mitotic spindles of dividing cells are also visible. (C,D) Many embryos present YCL asters, a radial MT organization in defined regions (white arrow). These YCL asters organize MT in clear domains, different from the MT network emerging from the YSL (grey arrow), and they are also visible in (E) bright-field imaging (black arrow) and can be clearly observed in the 3D volume rendering in Video S1. (F) Example of an embryo showing 5 YCL asters. (G) Some embryos (here a vegetal view) show up to 22 YCL asters, covering the entire YCL. (H) Schematic for the new configuration found in the transgenic line, not in scale. AP stands for animal pole and VP stands for vegetal pole. YCL asters coexist with AV parallel MT arrays and YSN MT mesh around YSN. (I) Comparison between the average number of YCL asters in eggs of selected Tg dclk2-GFP females. N stands for the total number of eggs analysed for the different females. All images except (A) are LSFM images. (H) Created with Adobe Illustrator CS6 (http://www.adobe.com).

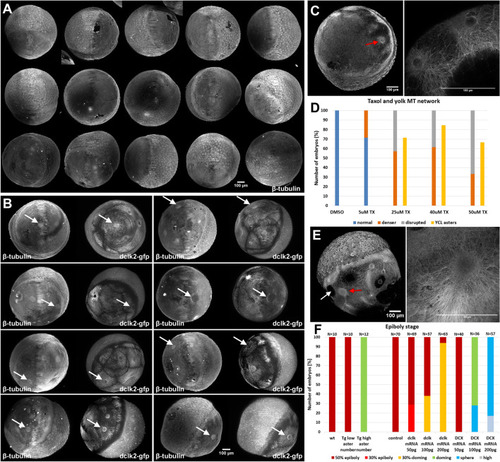
Natural and induced formation of YCL asters. (A,B) LSFM high-throughput screening of stained, previously fixed, embryos. (A) N = 15 wt embryos and (B) N = 8 dclk2-GFP embryos, immunostained against β-tubulin. On dclk2-GFP embryos, immunostaining reveals a high concentration of β-tubulin colocalizing with the dclk2-GFP signal in the YCL asters (white arrows in B). YCL asters are not visible in any wt embryo (A). (C) YCL asters form in the YCL upon dclk2-GFP overexpression in wt embryos. Ectopic asters appear in random positions (red arrow). Left: β-tubulin-stained embryo, low magnification vegetal view. Right: zoom in a couple of neighbouring asters. (D) Effect of Taxol on the organization of yolk MTs. Wt embryos were incubated with increasing drug concentrations from sphere stage. The yolk MT organization was evaluated in embryos fixed at 50% epiboly and immunostained for β-tubulin. The percentage of embryos with a denser (thick MTs) and a disrupted yolk MT network (MT bundles and MT free patches) increased progressively with higher drug concentration, compared to the normal organization of the yolk MT network in DMSO-incubated embryos (5 µM, N = 7; 25 µM, N = 7; 40 µM, N = 13; 50 µM, N = 12; DMSO, N = 15). Moreover, YCL asters appear from 25 µM Taxol dose. (TX: Taxol). (E) Representative wt embryo incubated with 40 µM Taxol and immunostained for β-tubulin. YCL asters appear in random positions (red arrow) and coexist with MT free regions (white arrow). Left: β-tubulin-stained embryo, low magnification lateral view. Right: zoom in one YCL aster. (F) Epiboly stage comparison between embryos of different conditions. Transgenic embryos with a high number of asters are delayed compared to their transgenic siblings having a small number of asters and compared to wt sibling embryos (first three columns in the graph). When control embryos (DMSO injected) are compared to dclk2-gfp and DCX-gfp mRNA injected embryos, epiboly delay correlates with the level of proteins overexpression (seven last columns in the graph).

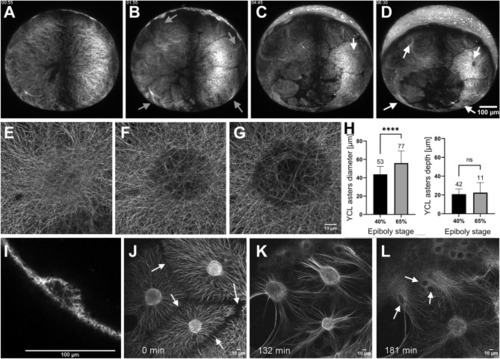
The YCL asters form and evolve throughout epiboly. (AD) Embryo vegetal view. (A) Before epiboly, the MT network uniformly covers the exposed yolk. (B) At sphere stage, the MT network acquires a new configuration and rearranges into clear domains, with a central high dense MT bundle emanating from each of them (grey arrows). (C) Emerging from those bundles, defined MTs domains start migrating vegetally following a flat to hemisphere transition, leading to the formation of a visible YCL aster (white arrow) with radially oriented MT fibers in the middle of each domain (D) See Video S3. (EG) High-resolution visualization of an aster formation through CSLM. See also Video S5. (H) After inspection of more than a hundred asters in different embryos we observe that, once formed, asters’ diameter increases with epiboly progression, while their depth remains constant. p-values: ****p < 0.0001, ns means p > 0.05. (I) A cross section of a YCL aster highlights its half-sphere shape. Aster’s dynamics are shown in Video S4 (J) The aster domains remain individualized with defined boundaries (white arrows), with clear opposing MT tips. (K) When the marginal blastoderm approaches the YCL asters (from the top left of the image), the MT network rearranges once again: thicker bundles are formed and reorient in the AV direction, and (L) the cores of the YCL asters actively migrate animalwards, concomitantly with eYSN undergoing epiboly (white arrows), until (L) they disappear underneath the YSL. See Videos S6 and S7.

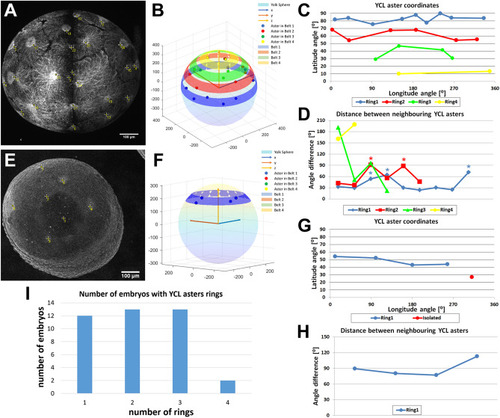
Analysis of the spatial YCL asters distribution in rings. (A) Maximum projection of a dclk2-GFP embryo where 22 YCL asters can be identified (yellow crosses) distributed in four rings. Identifiers 1 and 2 correspond to the vegetal pole and to the center of the embryo, respectively. (B) Projection of the aster position over the sphere modeling the yolk. Asters belonging to the same ring are represented by dots of the same color, rings are highlighted as belts at the calculated latitude. (C) YCL asters latitude (polar angle). YCL asters are not randomly located, but they group at four different latitudes (rings) (blue, red, green, and yellow). (D) Azimuthal angle differences between neighboring asters in rings 1 (blue), 2 (red), 3 (green), and 4 (yellow). Asters in this embryo are equidistant in 6/9 cases in ring1 and 4/6 cases in ring2. Cases with higher distances are marked with asterisks. (EH) The same analysis for an embryo with only one YCL asters ring. Here 5 YCL asters can be identified: 4 asters distributed around 360°, and one in the vegetal pole. Each aster is highlighted with a yellow cross in Fig. 3E. Identifiers 1 and 2 correspond to the vegetal pole and to the embryo center, respectively. For this particular case, asters are equidistant (H). (I) Plot of the distribution of YCL asters in 1, 2, 3, or 4 rings. The analysis was performed on 40 embryos. (B,F) Created with MATLAB R2020b (https://www.mathworks.com).

MT polymerization occurs at YSL and across the YCL. EB3-mCherry injected dclk2-GFP embryos allow us to simultaneously visualize MTs and MTs plus-ends. EB3-mCherry signal was found: (A) around e-YSN centrosomes (white arrows), as vegetalward oriented tracks in the YSL (blue arrows), and as scattered puncta all along the entire yolk cell [Merged signals, dclk2-GFP (green) and EB3-mCherry (red)]. See also Video S8. Whole imaging of the embryos using (B) CLSM and (C) LSFM also reveals the localization of EB3-mCherry signal at YCL asters (yellow arrows). (D) CLSM zoom in the YSL area to highlight YSL nuclei during division, in a EB3-mCherry injected dclk2-GFP transgenic embryo, fixed and stained with DAPI (blue). (E,F) Merged signals after adding the dclk2-GFP channel (green) to (B) and (C), respectively (red). (G,H) High resolution CLSM imaging of a YCL aster showing (G) EB3-mCherry signal and (H) its merge with the dclk2-GFP signal. (I) CLSM cross section of a YCL aster shows, through the EB3-mCherry signal, the MT polymerizing activity preferentially located at the periphery of the aster. (JL) High resolution CLSM imaging of a YCL aster in a dclk2-GFP embryo, fixed and stained for DAPI (blue) at 60% epiboly. (J) corresponds to yellow inset in (L). No chromatin enriched structures are detected in YCL asters.

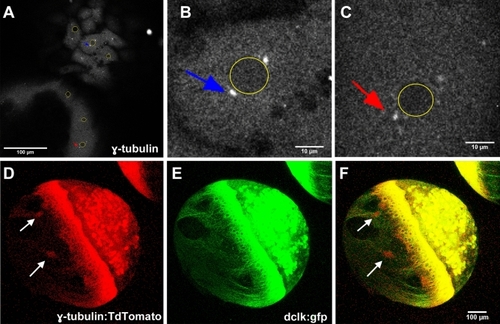
MT nucleation occurs at YSN centrosomes and YCL asters. γ-Tubulin expression can be observed through (AC) immunostaining on fixed embryos and (DF) in embryos coinjected with γ-tubulin-TdTomato mRNA and dclk2-gfp mRNA. γ-Tubulin signal has been found in (B) blastoderm centrosomes (blue arrow), (C) e-YSN centrosomes (red arrow) and (DF) YCL asters colocalizing with dclk2-GFP signal (white arrows). In (AC) the nuclei of both blastoderm and eYSN have been highlighted (yellow circles).

Acknowledgments
This image is the copyrighted work of the attributed author or publisher, and ZFIN has permission only to display this image to its users. Additional permissions should be obtained from the applicable author or publisher of the image. Full text @ Sci. Rep.