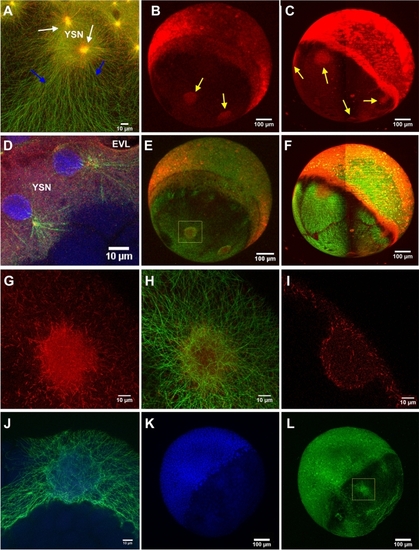
MT polymerization occurs at YSL and across the YCL. EB3-mCherry injected dclk2-GFP embryos allow us to simultaneously visualize MTs and MTs plus-ends. EB3-mCherry signal was found: (A) around e-YSN centrosomes (white arrows), as vegetalward oriented tracks in the YSL (blue arrows), and as scattered puncta all along the entire yolk cell [Merged signals, dclk2-GFP (green) and EB3-mCherry (red)]. See also Video S8. Whole imaging of the embryos using (B) CLSM and (C) LSFM also reveals the localization of EB3-mCherry signal at YCL asters (yellow arrows). (D) CLSM zoom in the YSL area to highlight YSL nuclei during division, in a EB3-mCherry injected dclk2-GFP transgenic embryo, fixed and stained with DAPI (blue). (E,F) Merged signals after adding the dclk2-GFP channel (green) to (B) and (C), respectively (red). (G,H) High resolution CLSM imaging of a YCL aster showing (G) EB3-mCherry signal and (H) its merge with the dclk2-GFP signal. (I) CLSM cross section of a YCL aster shows, through the EB3-mCherry signal, the MT polymerizing activity preferentially located at the periphery of the aster. (J–L) High resolution CLSM imaging of a YCL aster in a dclk2-GFP embryo, fixed and stained for DAPI (blue) at 60% epiboly. (J) corresponds to yellow inset in (L). No chromatin enriched structures are detected in YCL asters.
|
