IMAGE

Figure 1

ID
ZDB-IMAGE-220314-6
Source
Figures for Marsal et al., 2022
Image
Figure Caption

Figure 1

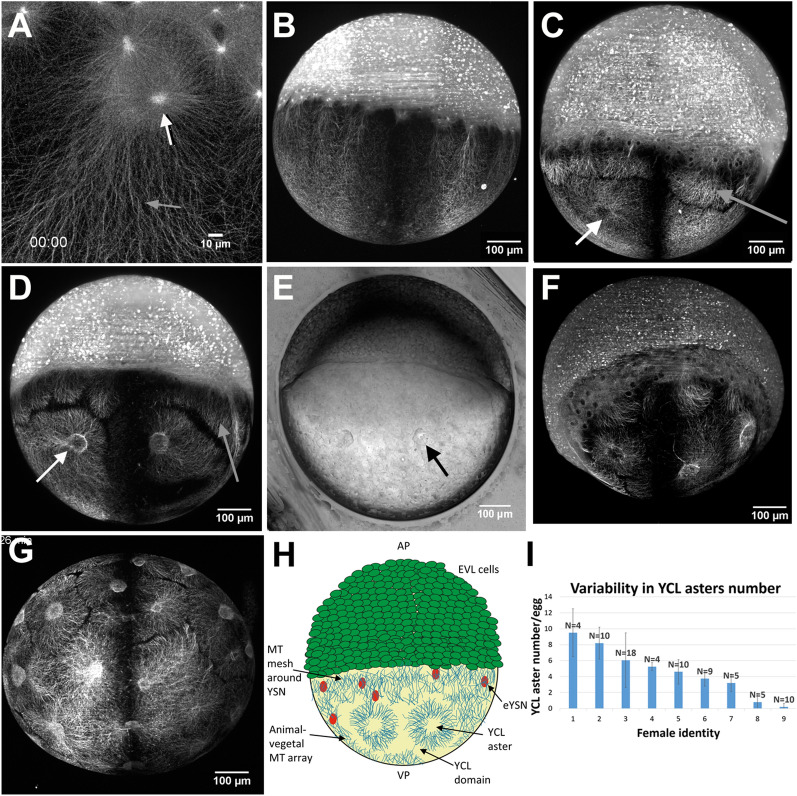
The variable presence of YCL asters in the yolk MT network of dclk2-GFP transgenic zebrafish embryos. (A) CLSM zoom into the YSL shows meshed interconnected MT with apparent spindles during mitosis of e-YSN (white arrow) and the AV parallel YCL MT arrays, emanating from MTOCs associated to the most vegetal e-YSN (grey arrow). (BF) Lateral views of transgenic embryos, with the animal pole at the top and the vegetal pole at the bottom. (B) At sphere stage, parallel MT arrays emerge from the YSL, covering the YCL. At the animal pole, mitotic spindles of dividing cells are also visible. (C,D) Many embryos present YCL asters, a radial MT organization in defined regions (white arrow). These YCL asters organize MT in clear domains, different from the MT network emerging from the YSL (grey arrow), and they are also visible in (E) bright-field imaging (black arrow) and can be clearly observed in the 3D volume rendering in Video S1. (F) Example of an embryo showing 5 YCL asters. (G) Some embryos (here a vegetal view) show up to 22 YCL asters, covering the entire YCL. (H) Schematic for the new configuration found in the transgenic line, not in scale. AP stands for animal pole and VP stands for vegetal pole. YCL asters coexist with AV parallel MT arrays and YSN MT mesh around YSN. (I) Comparison between the average number of YCL asters in eggs of selected Tg dclk2-GFP females. N stands for the total number of eggs analysed for the different females. All images except (A) are LSFM images. (H) Created with Adobe Illustrator CS6 (http://www.adobe.com).

Acknowledgments
This image is the copyrighted work of the attributed author or publisher, and ZFIN has permission only to display this image to its users. Additional permissions should be obtained from the applicable author or publisher of the image. Full text @ Sci. Rep.