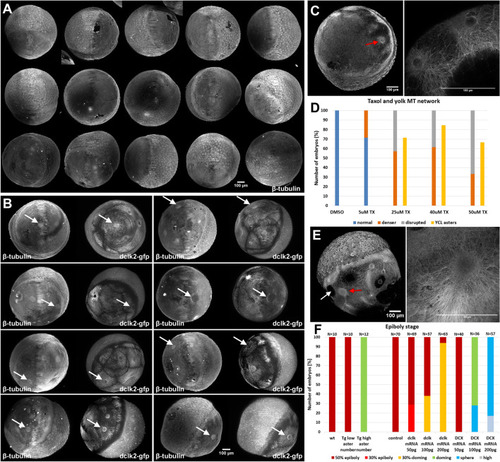
Natural and induced formation of YCL asters. (A,B) LSFM high-throughput screening of stained, previously fixed, embryos. (A) N = 15 wt embryos and (B) N = 8 dclk2-GFP embryos, immunostained against β-tubulin. On dclk2-GFP embryos, immunostaining reveals a high concentration of β-tubulin colocalizing with the dclk2-GFP signal in the YCL asters (white arrows in B). YCL asters are not visible in any wt embryo (A). (C) YCL asters form in the YCL upon dclk2-GFP overexpression in wt embryos. Ectopic asters appear in random positions (red arrow). Left: β-tubulin-stained embryo, low magnification vegetal view. Right: zoom in a couple of neighbouring asters. (D) Effect of Taxol on the organization of yolk MTs. Wt embryos were incubated with increasing drug concentrations from sphere stage. The yolk MT organization was evaluated in embryos fixed at 50% epiboly and immunostained for β-tubulin. The percentage of embryos with a denser (thick MTs) and a disrupted yolk MT network (MT bundles and MT free patches) increased progressively with higher drug concentration, compared to the normal organization of the yolk MT network in DMSO-incubated embryos (5 µM, N = 7; 25 µM, N = 7; 40 µM, N = 13; 50 µM, N = 12; DMSO, N = 15). Moreover, YCL asters appear from 25 µM Taxol dose. (TX: Taxol). (E) Representative wt embryo incubated with 40 µM Taxol and immunostained for β-tubulin. YCL asters appear in random positions (red arrow) and coexist with MT free regions (white arrow). Left: β-tubulin-stained embryo, low magnification lateral view. Right: zoom in one YCL aster. (F) Epiboly stage comparison between embryos of different conditions. Transgenic embryos with a high number of asters are delayed compared to their transgenic siblings having a small number of asters and compared to wt sibling embryos (first three columns in the graph). When control embryos (DMSO injected) are compared to dclk2-gfp and DCX-gfp mRNA injected embryos, epiboly delay correlates with the level of proteins overexpression (seven last columns in the graph).
|
