IMAGE

Figure 5

ID
ZDB-IMAGE-220314-10
Source
Figures for Marsal et al., 2022
Image
Figure Caption

Figure 5

MT polymerization occurs at YSL and across the YCL
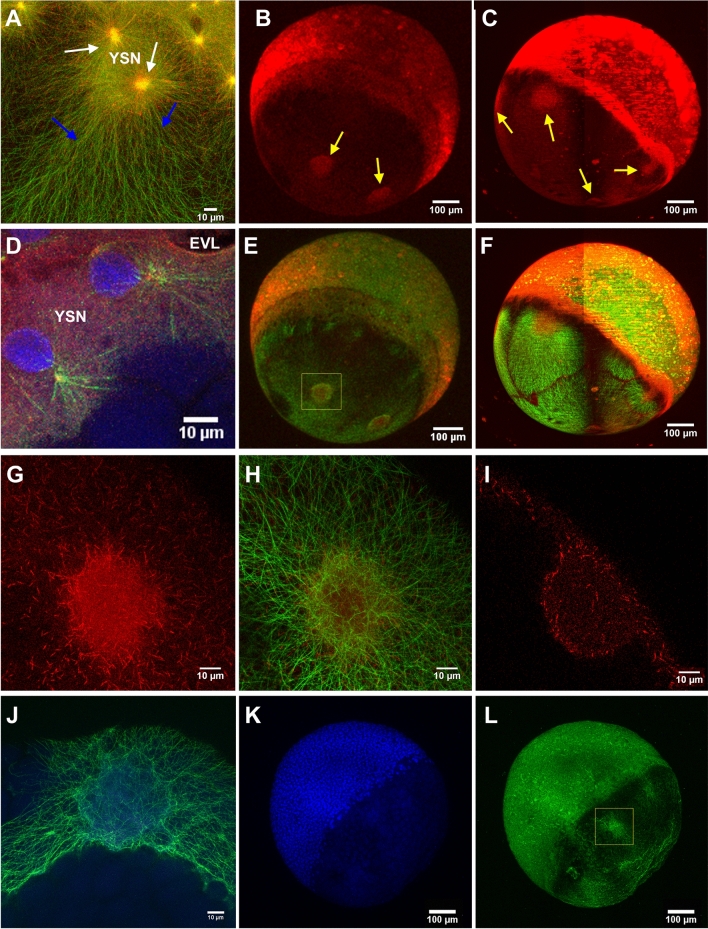
. EB3-mCherry injected dclk2-GFP embryos allow us to simultaneously visualize MTs and MTs plus-ends. EB3-mCherry signal was found: (A) around e-YSN centrosomes (white arrows), as vegetalward oriented tracks in the YSL (blue arrows), and as scattered puncta all along the entire yolk cell [Merged signals, dclk2-GFP (green) and EB3-mCherry (red)]. See also Video S8. Whole imaging of the embryos using (B) CLSM and (C) LSFM also reveals the localization of EB3-mCherry signal at YCL asters (yellow arrows). (D) CLSM zoom in the YSL area to highlight YSL nuclei during division, in a EB3-mCherry injected dclk2-GFP transgenic embryo, fixed and stained with DAPI (blue). (E,F) Merged signals after adding the dclk2-GFP channel (green) to (B) and (C), respectively (red). (G,H) High resolution CLSM imaging of a YCL aster showing (G) EB3-mCherry signal and (H) its merge with the dclk2-GFP signal. (I) CLSM cross section of a YCL aster shows, through the EB3-mCherry signal, the MT polymerizing activity preferentially located at the periphery of the aster. (JL) High resolution CLSM imaging of a YCL aster in a dclk2-GFP embryo, fixed and stained for DAPI (blue) at 60% epiboly. (J) corresponds to yellow inset in (L). No chromatin enriched structures are detected in YCL asters.

Acknowledgments
This image is the copyrighted work of the attributed author or publisher, and ZFIN has permission only to display this image to its users. Additional permissions should be obtained from the applicable author or publisher of the image. Full text @ Sci. Rep.