
- Title
-
The non-telomeric evolutionary trajectory of TRF2 in zebrafish reveals its specific roles in neurodevelopment and aging
- Authors
- Ying, Y., Hu, X., Han, P., Mendez-Bermudez, A., Bauwens, S., Eid, R., Tan, L., Pousse, M., Giraud-Panis, M.J., Lu, Y., Gilson, E., Ye, J.
- Source
- Full text @ Nucleic Acids Res.
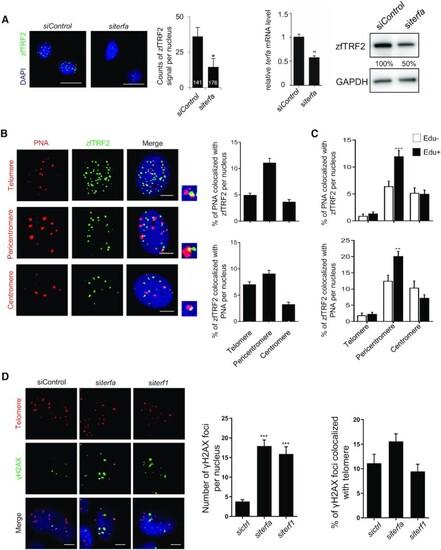
zfTRF2 downregulation leads to genome-wide DNA damage response with no telomere-specificity. (A) Representative image and quantification of immunofluorescence (left) and immunoblot (right) of zfTRF2 signal to identify the affinity of the purified anti-zfTRF2 antibodies for zfTRF2 in ZF4 cells following TERFA downregulation by siRNA. The number inside the column of the graph indicates the total number of nuclei was counted in three biological replicates. The knockdown efficiency of siRNA was validated by RT-qPCR. Scale bars, 20 μm. (B) Representative images and quantification of immunofluorescence of PNA probe(red) for telomeres (top), pericentromeres (middle) and centromeres (bottom) colocalizing with zfTRF2 (green) in ZF4 fish cells. (C) The percentage of the signals of PNA probes colocalized with zfTRF2 and percentage of zfTRF2 signals colocalized with PNA were shown in ZF4 cells classified by Edu + and Edu- with immunofluorescence assay. (D) Representative images and signal quantification of global and telomere-associated γH2AX foci in ZF4 fish cells upon terf1 and terfa downregulation. Scale bars, 7 μm. Data are shown as the mean ± standard error of the mean (SEM) of at least three biological replicates. For immunofluorescence and confocal section images, at least 30 nuclei were taken and counted in each sample for each biological replicate. Statistical analyses were performed using unpaired two-sided t tests (*P < 0.05, **P < 0.01, ***P < 0.001). |
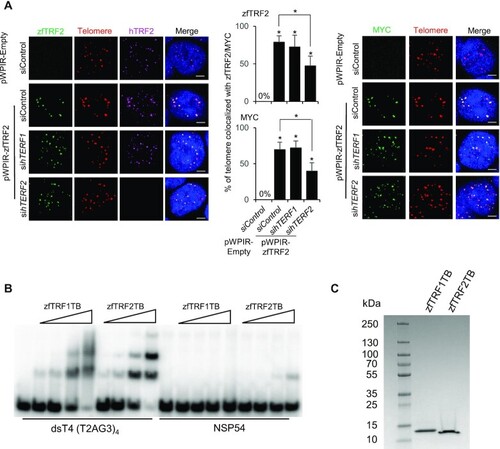
The ability of zfTRF2 binding to telomeres is preserved in human cells. (A) Representative confocal section images (left) and signal quantification (right) from a PNA-FISH assay of human 293T cells. The percentages of telomeres (red) that colocalized with zfTRF2 (green, left) or MYC (green, right) in transduced 293T cells overexpressing exogenous zfTRF2-MYC are shown. Human TRF2 (hTRF2) and hTRF1 were knocked down by siRNA for 72 h (scale bars, 7 μm). (B) EMSA showing the binding of the Telobox from zebrafish TRF1 (zfTRF1TB) and of the Telobox from zebrafish TRF2 (zfTRF2TB) on a four telomeric repeats containing DNA (dsT4) and a non-specific DNA of the same size (NSP54). Final concentration of the DNA was 5 nM and concentrations of proteins were: 10 nM, 30 nM, 100 nM and 300 nM. (C) Coomassie stained SDS PAGE where 5 μg of each protein was loaded. All data are shown as the mean ± SEM of three biological replicates. For immunofluorescence and confocal images, at least 30 nuclei were taken and counted in each sample for each biological replicate.Statistical analyses were performed using unpaired two-sided t tests (*P < 0.05, **P < 0.01, ***P < 0.001). Asterisks directly above columns indicate a significant difference between the indicated treatment and the control group (left). Asterisks above two columns indicate a significant difference between the two columns. |
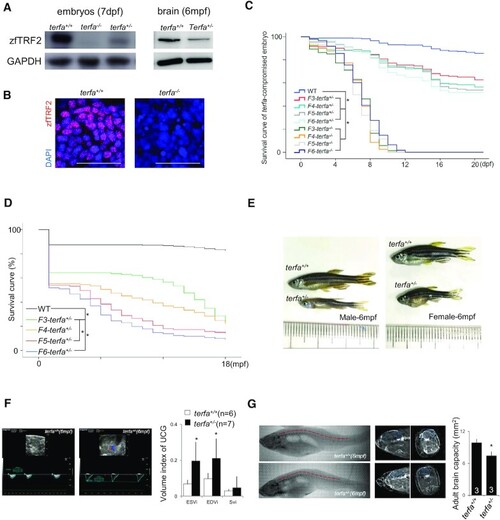
Zebrafish lacking zfTRF2 exhibit premature aging. (A) Western blot analysis of zfTRF2 expression in terfa-compromised embryos at 7 dpf (left) and fish brains at 6 months post-fertilization (mpf) (right). (B) Representative confocal images of zfTRF2 expression in terfa+/+ and terfa−/− zebrafish brain 1dpf (scale bar, 20 μm). (C, D) Survival curves of terfa-compromised (terfa+/− and terfa−/−) zebrafish during larvae stage (C, 0–21dpf) and adult stage (D, 0–18mpf) from generations F3 to F6. (E) Representative photographs of adult terfa+/+ and terfa+/− fish at 6 mpf. Left, male; right, female. (F) Representative ultrasonic cardiogram (UCG) images (left) and measurements (right) of terfa+/+ and terfa+/− zebrafish at 6 mpf. Volume indices from the UCGs are shown, including the end systolic volume index (ESVi), end diastolic volume index (EDVi), and systolic volume index (SVi). (G) Representative computed tomography (CT) images (left) and quantification (right) of zebrafish at 6 mpf. The images show 3D reconstructions of whole fish bodies developed using the CT images. The middle column show extracted two-dimensional (2D) images of the sagittal and coronal sections of the brain collected via CT. The graph (right) shows brain capacity following 3D reconstruction of the brain via CT. Data are shown as the mean ± SEM of three biological replicates. The number inside or below each column indicates the number of embryos detected for each condition. Statistical analyses were performed using unpaired two-sided t tests, and survival curves were plotted using a log-rank test (*P < 0.05). |

Zebrafish lacking zfTRF2 exhibit a specific neurodevelopmental failure. (A) Percentages of terfa-compromised embryos with indicated abnormal phenotypes during development (0–7 dpf). The dotted line indicates the dates at which the brain edema phenotype first presented and peaked. (B) Representative images (left) and signal quantification (right) from RNA fluorescence in situ hybridization (RNA-FISH) using tissue specific markers (neural tissue, neurog1; cardiovascular tissue, cmcl2; hemopoietic tissue, c-myb). Quantification was performed using ImageJ software (NIH). Neurog1 and cmcl2 signals were quantified by analyzing positive signals in the same area (10−2 mm2), and c-myb was quantified by counting foci (scale bar, 250 μm). (C) Representative images (left) and signal quantification (right) of SA-β-gal staining (up) of terfa-compromised embryos, acridine orange staining (middle) of terfa-compromised embryos and Light-sheet 3D reconstruction image of Tg(HuC:GFP) terfa-compromised brains at 3 dpf. Scale bar, 250 μm and 150 μm. (D) The neural cell types (neurons, glial cells, and progenitor cells) presented in terfa-compromised embryo brains at 3 dpf were quantified using flow cytometry. Left: the percentage of SOX2-positive (progenitor) cells was calculated by labeling embryos with anti-SOX2 antibody. Middle: percentage of GFP-positive cells (neurons) in terfa-compromised Tg(huc:GFP) embryos. Right: percentage of GFP-positive (glial) cells in terfa-compromised Tg(gfap:GFP) embryos. (E) Representative confocal section images (top) showing γH2AX foci colocalized with GFP-positive cells (green) in terfa+/+, terfa+/− or terfa−/− embryos at 3 dpf. GFP marked neurons in Tg(huc:GFP) brains and glial cells in Tg(gfap:GFP) brains. SOX2-positive cells represent progenitor cells (middle). The quantitative results (bottom) showing γH2AX foci (left) and TUNEL signals (right) colocalized with GFP-positive cells (green) in terfa+/+, terfa+/− or terfa−/− embryos at 3 dpf. Scale bars, 20 μm. Data are shown as the mean ± SEM of three biological replicates. The number inside or below each column indicates the number of embryos detected for each condition. Statistical analyses were performed using unpaired two-sided t tests, and survival curves were plotted using a log-rank test (*P < 0.05). |
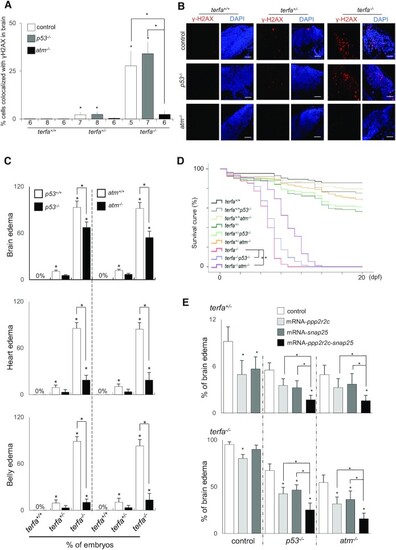
The embryonic neurodevelopmental failure results from both ATM activation and transcriptional dysregulation. (A, B) Representative (B) and quantification (A) of confocal section images of γH2AX foci (red) in the brains of terfa-compromised p53−/− or atm−/− embryos at 3 dpf (scale bars, 30 μm). (C) Percentages of terfa-compromised (terfa+/+, terfa+/−, terfa−/−) embryos with brain edema (left), heart edema (middle) and intestine edema (right) rescued by p53−/− or atm−/−. (D) Survival curve of terfa-compromised p53−/− or atm−/− embryos during development. (E) Percentages of embryos at 3 dpf with brain edema phenotypes after microinjection with the indicated mRNA (ppp2r2c, snap25 or ppp2r2c + snap25) in terfa+/−:p53−/− or terfa+/−:atm−/− (left) and terfa−/−:p53−/− or terfa−/−:atm−/− (right) embryos. All data are shown as the means ± SEM of three biological replicates. Statistical analyses were performed using unpaired two-sided t tests; survival curves were plotted using the log-rank test (*P < 0.05). The number below the graph indicates the total number of tested individual embryos. Asterisks directly above columns indicate a significant difference between the indicated treatment and the control group (left). Asterisks above two columns indicate a significant difference between the two columns. |
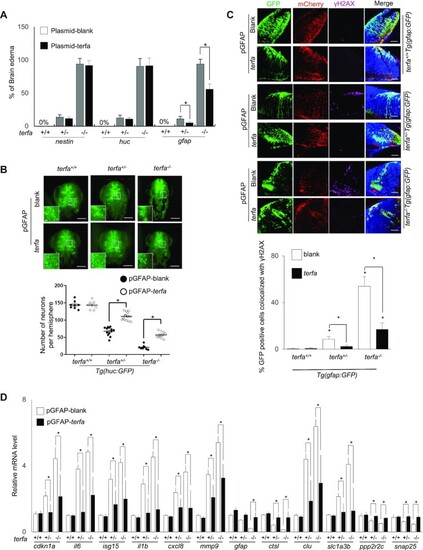
zfTRF2 plays a specific role in GFAP-positive cells during neurodevelopment. (A) Percentages of embryos exhibiting brain edema phenotypes at 3 dpf in terfa-compromised embryos following microinjection with the plasmids described in (Supplementary Figure S6A). (B) Representative three-dimensional (3D) computationally-reconstructed brain images of living embryos. Images were taken via light-sheet microscopy. Green signals indicate neurons of terfa-compromised Tg(huc:GFP) embryos at 3 dpf after microinjection with the plasmid of expression zfTRF2 meditate by GFAP promotor. GFP-positive cells in whole brains were quantified using Imaris software (Bitplane). scale bars, 150 μm. (C) Representative confocal section images (right) and quantification (left) showing γH2AX foci colocalized with GFP-positive or mCherry-positive cells in the brains of terfa-compromised Tg(gfap:GFP) embryos at 3 dpf, following microinjection plasmid of expression zfTRF2 meditate by GFAP promotor. The quantification (left) shows that percentages of GFP-positive cells that colocalized with γH2AX foci in terfa-compromised Tg(gfap:GFP) embryos, scale bars, 30 μm. (D) Transcript levels of candidate genes from RNA-seq in terfa+/+, terfa+/− and terfa−/− embryos at 3 dpf. Embryos were microinjected with the plasmids described in Supplementary Figure S6A. The mRNA transcript levels were measured using RT-qPCR. All data are shown as the mean ± SEM of three biological replicates. The number below each column indicates the number of embryos detected for each condition. Statistical analysis was performed using the unpaired two-sided t test, and survival curves were plotted using the log-rank test (*P < 0.05). Asterisks directly above columns indicate a significant difference between the indicated treatment and the control group (left). Asterisks above two columns indicate a significant difference between the two columns. |