
Figure 2.
- ID
- ZDB-FIG-220305-29
- Publication
- Ying et al., 2022 - The non-telomeric evolutionary trajectory of TRF2 in zebrafish reveals its specific roles in neurodevelopment and aging
- Other Figures
- All Figure Page
- Back to All Figure Page
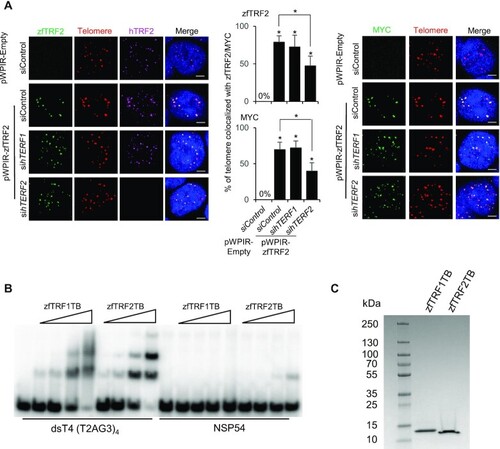
The ability of zfTRF2 binding to telomeres is preserved in human cells. (A) Representative confocal section images (left) and signal quantification (right) from a PNA-FISH assay of human 293T cells. The percentages of telomeres (red) that colocalized with zfTRF2 (green, left) or MYC (green, right) in transduced 293T cells overexpressing exogenous zfTRF2-MYC are shown. Human TRF2 (hTRF2) and hTRF1 were knocked down by siRNA for 72 h (scale bars, 7 μm). (B) EMSA showing the binding of the Telobox from zebrafish TRF1 (zfTRF1TB) and of the Telobox from zebrafish TRF2 (zfTRF2TB) on a four telomeric repeats containing DNA (dsT4) and a non-specific DNA of the same size (NSP54). Final concentration of the DNA was 5 nM and concentrations of proteins were: 10 nM, 30 nM, 100 nM and 300 nM. (C) Coomassie stained SDS PAGE where 5 μg of each protein was loaded. All data are shown as the mean ± SEM of three biological replicates. For immunofluorescence and confocal images, at least 30 nuclei were taken and counted in each sample for each biological replicate.Statistical analyses were performed using unpaired two-sided t tests (*P < 0.05, **P < 0.01, ***P < 0.001). Asterisks directly above columns indicate a significant difference between the indicated treatment and the control group (left). Asterisks above two columns indicate a significant difference between the two columns. |