
Figure 3.
- ID
- ZDB-FIG-220305-30
- Publication
- Ying et al., 2022 - The non-telomeric evolutionary trajectory of TRF2 in zebrafish reveals its specific roles in neurodevelopment and aging
- Other Figures
- All Figure Page
- Back to All Figure Page
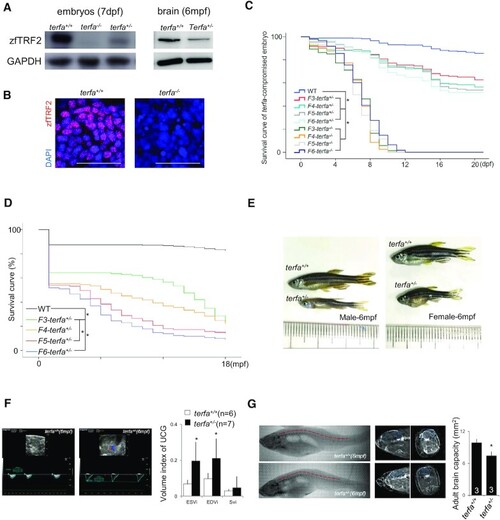
Zebrafish lacking zfTRF2 exhibit premature aging. (A) Western blot analysis of zfTRF2 expression in terfa-compromised embryos at 7 dpf (left) and fish brains at 6 months post-fertilization (mpf) (right). (B) Representative confocal images of zfTRF2 expression in terfa+/+ and terfa−/− zebrafish brain 1dpf (scale bar, 20 μm). (C, D) Survival curves of terfa-compromised (terfa+/− and terfa−/−) zebrafish during larvae stage (C, 0–21dpf) and adult stage (D, 0–18mpf) from generations F3 to F6. (E) Representative photographs of adult terfa+/+ and terfa+/− fish at 6 mpf. Left, male; right, female. (F) Representative ultrasonic cardiogram (UCG) images (left) and measurements (right) of terfa+/+ and terfa+/− zebrafish at 6 mpf. Volume indices from the UCGs are shown, including the end systolic volume index (ESVi), end diastolic volume index (EDVi), and systolic volume index (SVi). (G) Representative computed tomography (CT) images (left) and quantification (right) of zebrafish at 6 mpf. The images show 3D reconstructions of whole fish bodies developed using the CT images. The middle column show extracted two-dimensional (2D) images of the sagittal and coronal sections of the brain collected via CT. The graph (right) shows brain capacity following 3D reconstruction of the brain via CT. Data are shown as the mean ± SEM of three biological replicates. The number inside or below each column indicates the number of embryos detected for each condition. Statistical analyses were performed using unpaired two-sided t tests, and survival curves were plotted using a log-rank test (*P < 0.05). |