
|
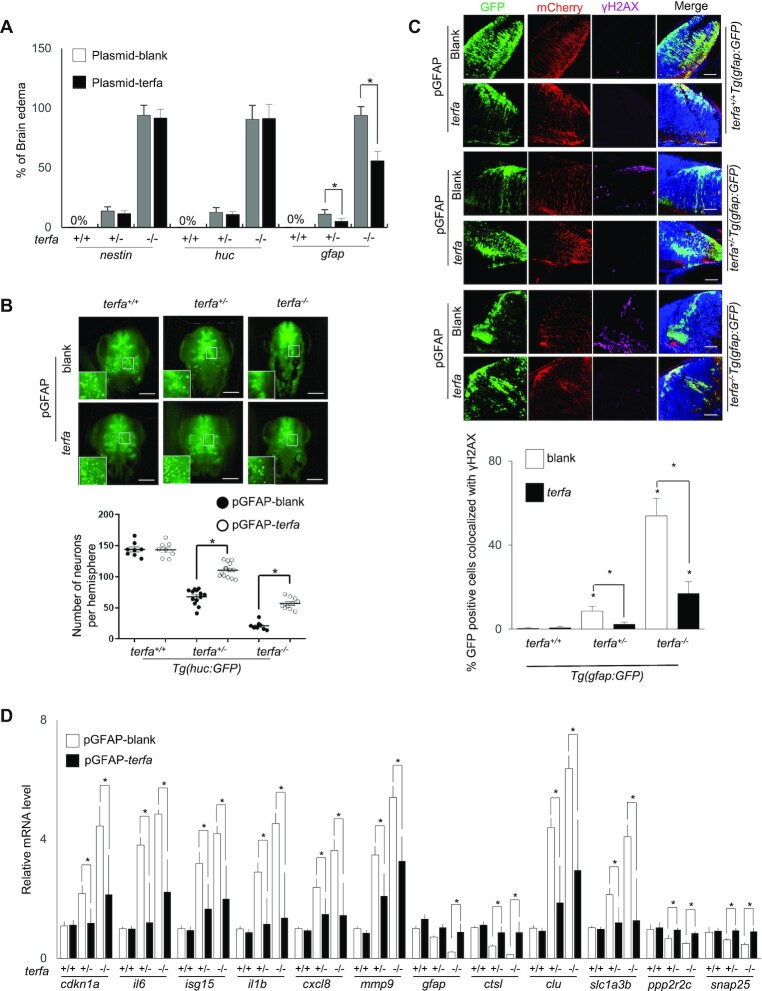
Figure 6.
zfTRF2 plays a specific role in GFAP-positive cells during neurodevelopment. (A) Percentages of embryos exhibiting brain edema phenotypes at 3 dpf in terfa-compromised embryos following microinjection with the plasmids described in (Supplementary Figure S6A). (B) Representative three-dimensional (3D) computationally-reconstructed brain images of living embryos. Images were taken via light-sheet microscopy. Green signals indicate neurons of terfa-compromised Tg(huc:GFP) embryos at 3 dpf after microinjection with the plasmid of expression zfTRF2 meditate by GFAP promotor. GFP-positive cells in whole brains were quantified using Imaris software (Bitplane). scale bars, 150 μm. (C) Representative confocal section images (right) and quantification (left) showing γH2AX foci colocalized with GFP-positive or mCherry-positive cells in the brains of terfa-compromised Tg(gfap:GFP) embryos at 3 dpf, following microinjection plasmid of expression zfTRF2 meditate by GFAP promotor. The quantification (left) shows that percentages of GFP-positive cells that colocalized with γH2AX foci in terfa-compromised Tg(gfap:GFP) embryos, scale bars, 30 μm. (D) Transcript levels of candidate genes from RNA-seq in terfa+/+, terfa+/− and terfa−/− embryos at 3 dpf. Embryos were microinjected with the plasmids described in Supplementary Figure S6A. The mRNA transcript levels were measured using RT-qPCR. All data are shown as the mean ± SEM of three biological replicates. The number below each column indicates the number of embryos detected for each condition. Statistical analysis was performed using the unpaired two-sided t test, and survival curves were plotted using the log-rank test (*P < 0.05). Asterisks directly above columns indicate a significant difference between the indicated treatment and the control group (left). Asterisks above two columns indicate a significant difference between the two columns.