
|
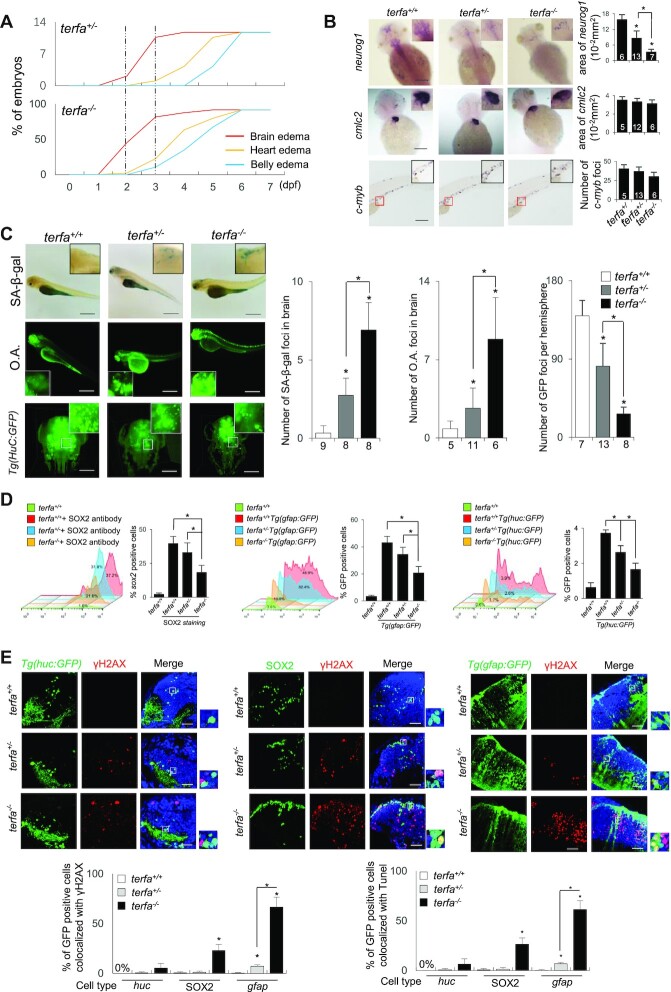
Figure 4.
Zebrafish lacking zfTRF2 exhibit a specific neurodevelopmental failure. (A) Percentages of terfa-compromised embryos with indicated abnormal phenotypes during development (0–7 dpf). The dotted line indicates the dates at which the brain edema phenotype first presented and peaked. (B) Representative images (left) and signal quantification (right) from RNA fluorescence in situ hybridization (RNA-FISH) using tissue specific markers (neural tissue, neurog1; cardiovascular tissue, cmcl2; hemopoietic tissue, c-myb). Quantification was performed using ImageJ software (NIH). Neurog1 and cmcl2 signals were quantified by analyzing positive signals in the same area (10−2 mm2), and c-myb was quantified by counting foci (scale bar, 250 μm). (C) Representative images (left) and signal quantification (right) of SA-β-gal staining (up) of terfa-compromised embryos, acridine orange staining (middle) of terfa-compromised embryos and Light-sheet 3D reconstruction image of Tg(HuC:GFP) terfa-compromised brains at 3 dpf. Scale bar, 250 μm and 150 μm. (D) The neural cell types (neurons, glial cells, and progenitor cells) presented in terfa-compromised embryo brains at 3 dpf were quantified using flow cytometry. Left: the percentage of SOX2-positive (progenitor) cells was calculated by labeling embryos with anti-SOX2 antibody. Middle: percentage of GFP-positive cells (neurons) in terfa-compromised Tg(huc:GFP) embryos. Right: percentage of GFP-positive (glial) cells in terfa-compromised Tg(gfap:GFP) embryos. (E) Representative confocal section images (top) showing γH2AX foci colocalized with GFP-positive cells (green) in terfa+/+, terfa+/− or terfa−/− embryos at 3 dpf. GFP marked neurons in Tg(huc:GFP) brains and glial cells in Tg(gfap:GFP) brains. SOX2-positive cells represent progenitor cells (middle). The quantitative results (bottom) showing γH2AX foci (left) and TUNEL signals (right) colocalized with GFP-positive cells (green) in terfa+/+, terfa+/− or terfa−/− embryos at 3 dpf. Scale bars, 20 μm. Data are shown as the mean ± SEM of three biological replicates. The number inside or below each column indicates the number of embryos detected for each condition. Statistical analyses were performed using unpaired two-sided t tests, and survival curves were plotted using a log-rank test (*P < 0.05).