
- Title
-
The developmental hourglass model is applicable to the spinal cord based on single-cell transcriptomes and non-conserved cis-regulatory elements
- Authors
- Mukaigasa, K., Sakuma, C., Yaginuma, H.
- Source
- Full text @ Dev. Growth Diff.
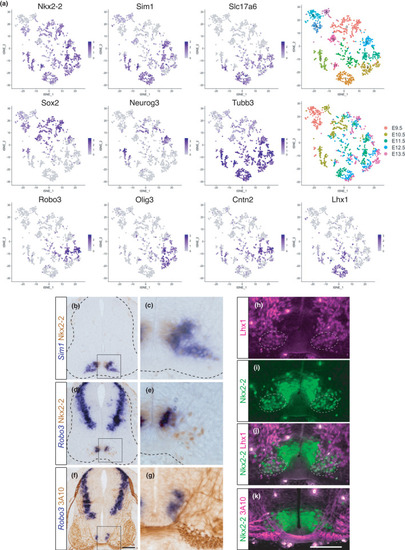
Two distinct subtypes of V3 INs in mice. (a) tSNE plot showing the cells with V3 IN identity derived from mouse embryonic spinal cords. The expression levels of the genes indicated are visualized on the tSNE plot. The top right panel shows the result of graph‐based clustering, with each cluster being colored differently. Cluster numbers (0–11) are labeled. The middle right panel shows the embryonic day when cells are corrected. (b–g) The expressions of Nkx2‐2, |
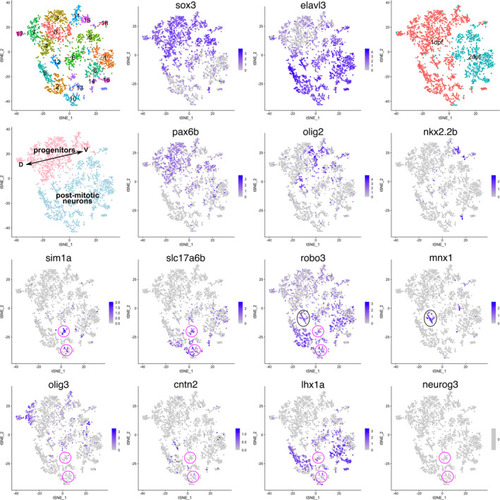
The gene expression profile of V3 IN in zebrafish is distinct from that in amniotes. tSNE plot showing the cells with spinal cord identity derived from zebrafish embryos (1 and 2 dpf). The top left panel shows the result of graph‐based clustering, with each cluster being colored differently. Cluster numbers (0–18) are labeled. The top right panel shows the embryonic day when the cells are corrected. The left‐most panel in the second row shows progenitors and post‐mitotic neurons with distinct colors. D and V indicate dorsal and ventral, respectively. The other panels show the expression levels of the indicated genes. The magenta and black circles indicate V3 INs and MNs, respectively |
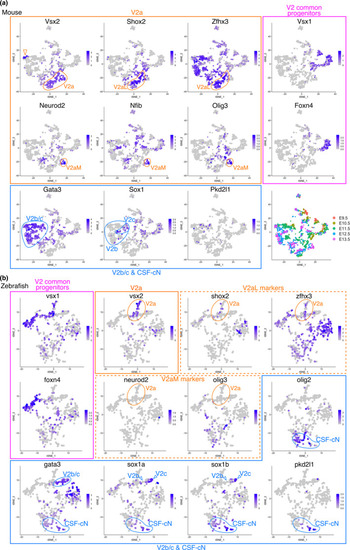
Distinct gene expression profiles in V2 INs between mice and zebrafish. tSNE plot showing the cells with V2 IN identity derived from mouse (a) and zebrafish (b) embryonic spinal cords. The expression levels of the indicated genes were visualized on the tSNE plot. Plots for V2 common progenitor markers are enclosed in magenta boxes. Plots for V2a IN markers are enclosed in yellow boxes. Plots for the V2b/c IN and CSF‐cN markers are enclosed in blue boxes. The bottom right panel in (a) shows the embryonic day when the cells are corrected. Within the tSNE plots, specific subpopulations (V2a, V2aM, V2aL, V2b, V2c, and CSF‐cNs) are indicated. The expression profiles of V2aL and V2aM markers (shox2, zfhx3, neurod2, and olig3) in zebrafish were different from those in mice (yellow broken‐line boxes in b). The Vsx2‐high minor population was found in the mouse tSNE plot as a distinct cluster (open arrowhead in a), which is likely to be type‐I V2a neurons, and other major V2a INs are probably type‐II neurons (Hayashi et al., |
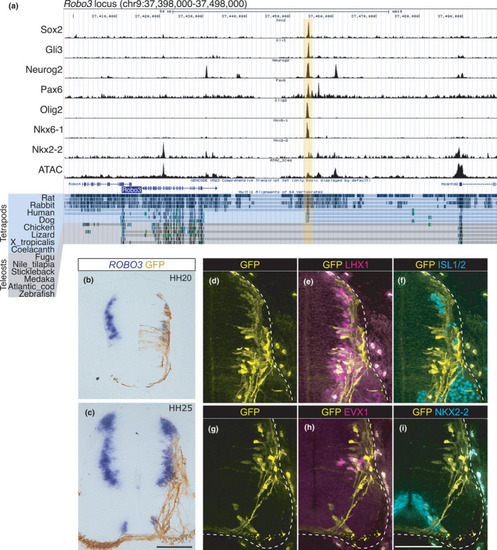
The CRM in the Robo3 locus is not conserved in teleosts. (a) ChIP-seq and ATAC-seq peak call results are displayed in the UCSC genome browser with Multiz Alignments track. The Robo3 locus in the mouse genome (mm10) is displayed. The region harboring multiple TF binding sites (Robo3-CRM) is highlighted in yellow. Multiz Alignment tracks of tetrapods and teleosts are highlighted by different colors. (b–i) Robo3-CRM::GFP was electroporated into chick neural tubes. (b, c) The expression of GFP and ROBO3 was examined at HH20 (b) and HH25 (c) after electroporation. (d–i) The expression of the GFP and TFs indicated was examined at HH25 after electroporation. The edges of the neural tube are demarcated by the broken lines. The embryo numbers examined in the electroporation experiments are provided in Table S5. Scale bar: 100 μm in c for b and c, in i for d–i |

Non-conservation of GBSs in Gli1 and Ptch1 loci in vertebrates. (a, b) Gli1/3 ChIP-seq and ATAC-seq peak call results are displayed in the UCSC genome browser with the Multiz Alignments track. The Gli1 (a) and Ptch1 (b) loci in the mouse genome (mm10) are shown. In the Gli1 locus, the Multiz Alignment tracks of mammals and non-mammals are highlighted by different colors. In the Ptch1 locus, the Multiz Alignment tracks of tetrapods and teleosts are highlighted by different colors. The positions of GBSs are highlighted in yellow, and are indicated by sequential numbers in the Gli1 and Ptch1 loci independently. (c) The Gli binding motif represented by the sequence logo. (d) The DNA sequence of each GBS indicated in (a) and (b). The extent of conservation of each GBS is shown in the “Conserved in” column. More detailed conservation profiles are presented in Figure S7 |
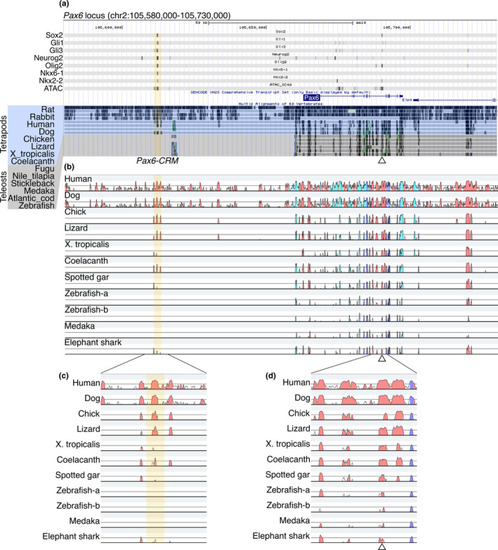
Identification of Pax6-CRM and its diversification in vertebrates. (a) ChIP-seq and ATAC-seq peak call results are displayed in the UCSC genome browser with Multiz Alignments track (the display mode is dense). The mouse Pax6 locus is displayed. Regions harboring multiple TF binding sites (Pax6-CRM) are highlighted in yellow, and a previously validated CRM is indicated by an open triangle under the track (Oosterveen et al.,2012). (b) The same genomic regions from several species are aligned, and sequence conservation is visualized by VISTA. The base sequence is mouse, and the species compared are indicated on the left side. The peaks of the conserved regions are colored pink (noncoding sequences), dark blue (exons), or light blue (UTRs). Zebrafish possess two pax6 genes (pax6a and pax6b); thus, both loci are included in the alignments (Zebrafish-a and Zebrafish-b correspond to the pax6a and pax6b loci, respectively). (c, d) Enlarged view of the plot focusing on CRMs. The previously identified CRM located in the intron is conserved in all species examined (d), whereas the Pax6-CRM highlighted in yellow is not conserved in zebrafish and medaka (c) |

Enhancer functions of CRMs of progenitor fate-specifying TFs. The CRM reporter vectors indicated were electroporated into chick neural tubes together with CAGGS::mCherry as a control vector. (a–j) The GFP and mCherry expression was examined at HH19–20 in the forelimb-level neural tube. (k–o) The endogenous expression of the indicated genes was examined by in situ hybridization (l, m, n) or immunohistochemistry (k, o) together with the GFP expression. These five CRMs displayed enhancer functions, although the GFP expression domains incompletely overlapped with the endogenous expression domain. Pax6-CRM induced GFP expression almost ubiquitously, but its expression was not observed in the roof plate (a, f, k). Gsx1-CRM induced GFP expression in the dorsal neural tube, but not in the more ventral region than the endogenous expression domain (b, g, l). The GFP expression domains induced by Dbx2-CRM or Irx3-CRM2 overlapped with the endogenous expression domain almost completely (c, d, h, i, m, and n). Olig2-CRM2 induced GFP expression in the intermediate to ventral region, which partially overlapped with, but was more dorsal than, the endogenous expression domain (e, j, and o). The number of embryos examined in the electroporation experiments is presented in Table S5. Scale bar: 100 μm |
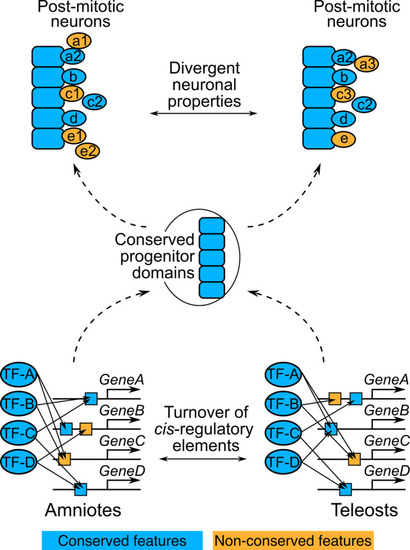
The hourglass-like pattern of the developmental divergence of the spinal cord. A summary of this study is presented. In this drawing, development proceeds from the bottom to the top. Only five progenitor domains were set up for simplification. Conserved and non-conserved features are colored in blue and orange, respectively. The bottom drawing represents GRNs regulating the progenitor domain establishment. CRMs (indicated by boxes) located in the progenitor fate specifying genes (GeneA–D) diverged (turnover) between amniotes and teleosts (orange boxes). Accordingly, these GRNs have been rewired. Nevertheless, these distinct GRNs result in the same progenitor domain organization. The top drawing represents the divergence of the differentiation process of post-mitotic neurons. After individual cells leave the progenitor domains as post-mitotic neurons (indicated by circles), some neurons undergo distinct maturation processes between amniotes and teleosts (orange circles). Thus, there exist neuronal subpopulations whose function is different between amniotes and teleosts |