
FIGURE 8
- ID
- ZDB-FIG-220722-24
- Publication
- Mukaigasa et al., 2021 - The developmental hourglass model is applicable to the spinal cord based on single-cell transcriptomes and non-conserved cis-regulatory elements
- Other Figures
- All Figure Page
- Back to All Figure Page
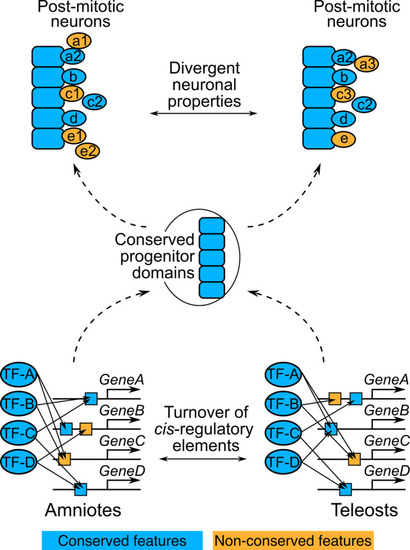
The hourglass-like pattern of the developmental divergence of the spinal cord. A summary of this study is presented. In this drawing, development proceeds from the bottom to the top. Only five progenitor domains were set up for simplification. Conserved and non-conserved features are colored in blue and orange, respectively. The bottom drawing represents GRNs regulating the progenitor domain establishment. CRMs (indicated by boxes) located in the progenitor fate specifying genes (GeneA–D) diverged (turnover) between amniotes and teleosts (orange boxes). Accordingly, these GRNs have been rewired. Nevertheless, these distinct GRNs result in the same progenitor domain organization. The top drawing represents the divergence of the differentiation process of post-mitotic neurons. After individual cells leave the progenitor domains as post-mitotic neurons (indicated by circles), some neurons undergo distinct maturation processes between amniotes and teleosts (orange circles). Thus, there exist neuronal subpopulations whose function is different between amniotes and teleosts |