
|
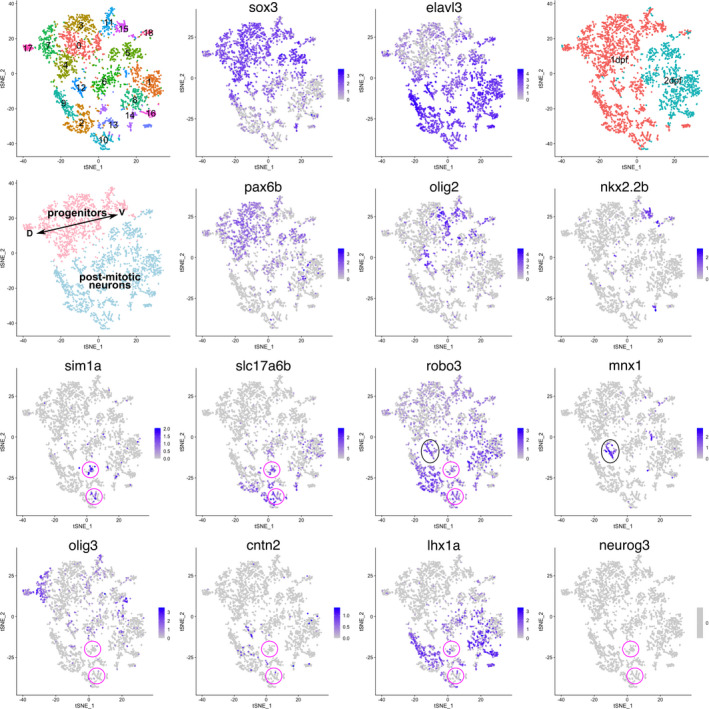
FIGURE 2
The gene expression profile of V3 IN in zebrafish is distinct from that in amniotes. tSNE plot showing the cells with spinal cord identity derived from zebrafish embryos (1 and 2 dpf). The top left panel shows the result of graph‐based clustering, with each cluster being colored differently. Cluster numbers (0–18) are labeled. The top right panel shows the embryonic day when the cells are corrected. The left‐most panel in the second row shows progenitors and post‐mitotic neurons with distinct colors. D and V indicate dorsal and ventral, respectively. The other panels show the expression levels of the indicated genes. The magenta and black circles indicate V3 INs and MNs, respectively