FIGURE

FIGURE 1

ID
ZDB-FIG-220722-17
Publication
Mukaigasa et al., 2021 - The developmental hourglass model is applicable to the spinal cord based on single-cell transcriptomes and non-conserved cis-regulatory elements
Other Figures
All Figure Page
Back to All Figure Page
FIGURE 1

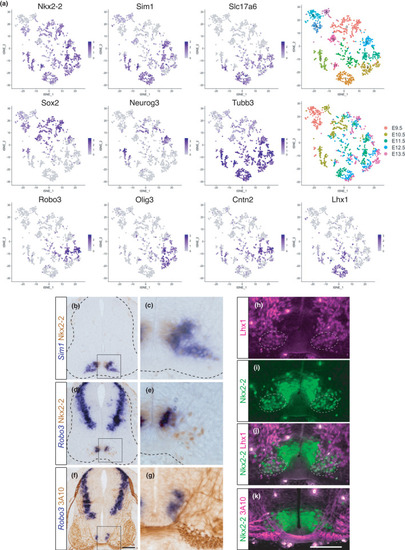
Two distinct subtypes of V3 INs in mice. (a) tSNE plot showing the cells with V3 IN identity derived from mouse embryonic spinal cords. The expression levels of the genes indicated are visualized on the tSNE plot. The top right panel shows the result of graph‐based clustering, with each cluster being colored differently. Cluster numbers (0–11) are labeled. The middle right panel shows the embryonic day when cells are corrected. (b–g) The expressions of Nkx2‐2, Sim1, and Robo3 were examined in the mouse spinal cord at the forelimb level at E11.5. Growing axons were visualized by monoclonal antibody 3A10. Staining of in situ hybridization and immunohistochemistry was colored by blue and brown, respectively. c, e, and g show the enlarged views of the boxed areas in b, d, and f, respectively. The edges of the neural tube are demarcated by the broken lines. (h–j) Immunohistochemistry using Nkx2‐2 and Lhx1 antibodies. Nkx2‐2 and Lhx1 double‐positive cells are indicated by the broken‐line circles. (k) Immunohistochemistry using Nkx2‐2 and 3A10 antibodies. The ventral‐most region of the spinal cord is shown in h–k. Scale bar: 100 μm in f for b, d and f, and in k for h–k

Expression Data

Expression Detail
Antibody Labeling
Phenotype Data

Phenotype Detail
Acknowledgments
This image is the copyrighted work of the attributed author or publisher, and ZFIN has permission only to display this image to its users. Additional permissions should be obtained from the applicable author or publisher of the image. Full text @ Dev. Growth Diff.