
- Title
-
Effects of Diethylstilbestrol on Zebrafish Gonad Development and Endocrine Disruption Mechanism
- Authors
- Liu, X., Xie, X., Liu, H.
- Source
- Full text @ Biomolecules
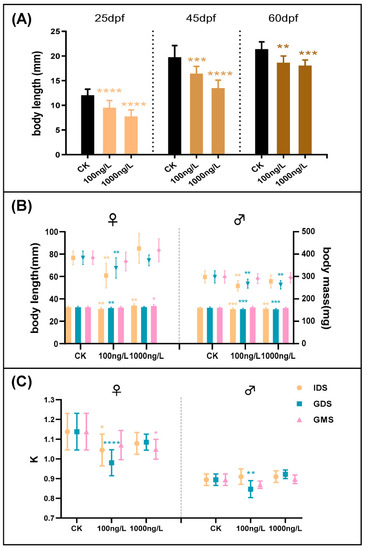
(A) Body length measured after diethylstilbestrol (DES) exposure at 25 dpf, 45 dpf, and 60 dpf, respectively. (B) Body length and body weight of zebrafish maintained after exposure, measured at 90 dpf. Different shapes of dots are body weight, and histogram is the body length (yellow is initial development stage (IDS), blue is gonadal differentiation stage (GDS), and pink is gonadal maturity stage (GMS)). (C) The plumpness (K) of zebrafish maintained after exposure, measured at 90 dpf. Values are shown as the mean ± SD (n = 3 replicates per treatment, n = 11 fish per replicate at 25, 45, and 60 dpf, and n = 15 fish per replicate at 90 dpf). Asterisks denote significant differences between control and treatments (* p < 0.05, ** p < 0.01, *** p < 0.005, and **** p < 0.0001, according to Dunnett’s multiple comparisons test). CK-control group. PHENOTYPE:
|

(A) Gonadosomatic index (GSI) of zebrafish at 90 dpf for every group. (n = 15 fish per replicate at 90 dpf). (B) Sex ratio of zebrafish at 90 dpf for every group. (n = 6 fish per replicate at 90 dpf). Values are shown as mean ± SD (n = 3 replicates per treatment). Asterisks denote significant differences between control and treatments (* p < 0.05, ** p < 0.01, and *** p < 0.005, according to Dunnett’s multiple comparisons test). CK-control group. PHENOTYPE:
|
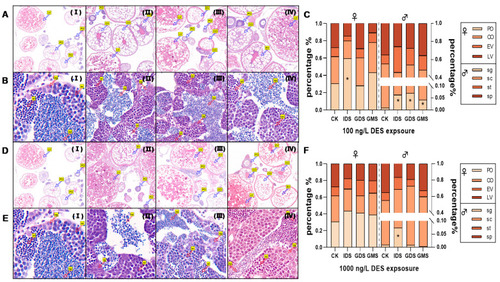
(A,B) are tissue slices from zebrafish exposed to 100 ng/L DES, (D,E) are tissue slices for 1000 ng/L DES. I–IV stand for different exposure groups (control, IDS, GDS and GMS, respectively). Percentages of egg cells and sperm cells in different development stages in females and males at 90 dpf in (C) (100 ng/L) and (D) (1000 ng/L), respectively. (C) and (F) are percentage of eggs cells and sperm cells exposed to 100 ng/L and 1000 ng/L, respectively. Values are shown as mean (n = 3 replicates per treatment, n = 2 fish per gender of each replicate with 2 cross sections). Asterisks denote significant differences between control and treatments (* p < 0.05, according to Dunnett’s test).LV: late vitellogenesis oocytes; EV: early vitellogenesis oocytes; CO: cortical granular oocytes; PO: perinuclear oocytes; sp: spermatogonia; sc: spermatocytes; st:spermatids; sp: sperm. PHENOTYPE:
|
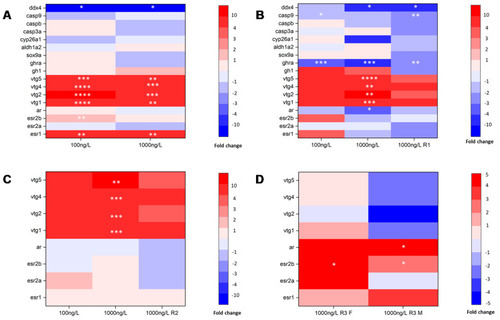
Genes for growth, HPG axis, sex hormone receptor, and gonadal differentiation and development) expression in every exposure stage. (A) IDS exposure group at 25 dpf; (B) GDS exposure group and the highest concentration (1000 ng/L) IDS exposure group at 45 dpf; (C) GMS exposure group and highest concentration GDS exposure group at 60 dpf; (D) highest concentration GMS exposure group at 90 dpf. Mean values of normalized transcript levels in each treatment were used to draw heat map (n = 3 replicates per treatment, n = 3 fish per replicate at 25 dpf, and n =1 fish per replicate at 45, 60, and 90 dpf). Asterisks denote significant differences between the control and treatments (* p < 0.05, ** p < 0.01, *** p < 0.005 and **** p < 0.0001, according to Dunnett’s multiple comparisons test). R1: IDS exposure group at 45 dpf. R2: GDS exposure group at 60 dpf. R3: GMS exposure group at 90 dpf. F: female. M: male. EXPRESSION / LABELING:
PHENOTYPE:
|