
- Title
-
Propionate induces intestinal oxidative stress via Sod2 propionylation in zebrafish
- Authors
- Ding, Q., Zhang, Z., Li, Y., Liu, H., Hao, Q., Yang, Y., Ringø, E., Olsen, R.E., Clarke, J.L., Ran, C., Zhou, Z.
- Source
- Full text @ iScience
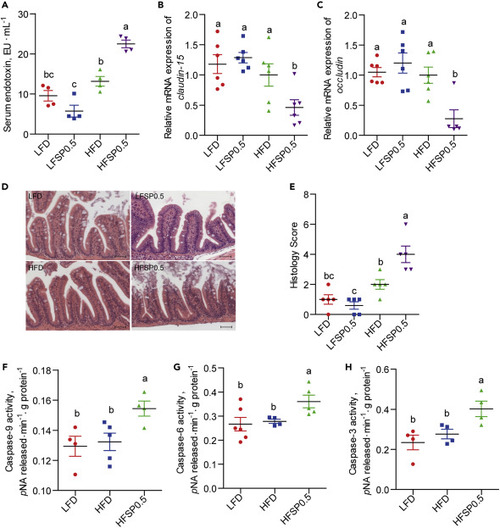
(A) Serum endotoxin in LFD-, LFSP0.5-, HFD-, and HFSP0.5-fed zebrafish at the end of the 2-week feeding trial (n = 4). (B and C) The relative mRNA expression of (B) claudin-15 and (C) occludin in the intestine of LFD-, LFSP0.5-, HFD-, and HFSP0.5-fed zebrafish at the end of 2-week feeding trial (n = 5–6). (D) Representative histopathologic image of H&E-stained intestinal sections. The scale bar, 50 μm. (E) Histological score measuring the severity of the intestinal damage of zebrafish (n = 5). (F–H) (F) Caspase-9, (G) caspase-6, and (H) caspase-3 activities in the intestine of 1-month-old zebrafish fed the LFD, HFD, or HFSP0.5 for 2 weeks (n = 4–6). Values are means ± SEM. Means without a common letter are significantly different (p < 0.05). Duncan's test. LFD, low-fat diet; LFSP0.5, 0.5% propionate-supplemented LFD; HFD, high-fat diet; HFSP0.5, 0.5% propionate-supplemented HFD. |
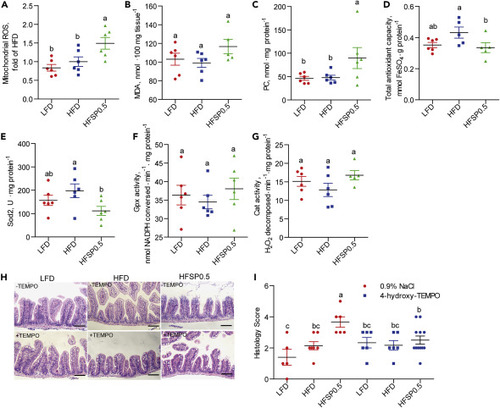
(A–C) Intestinal biomarkers for oxidative stress in 1-month-old zebrafish fed the LFD, HFD, or HFSP0.5 for 2 weeks, including (A) mitochondrial ROS, (B) MDA, and (C) PC. (D) Intestinal total antioxidant capability in 1-month-old zebrafish fed LFD, HFD, or HFSP0.5 for 2 weeks. (E–G) Intestinal antioxidant enzymes in 1-month-old zebrafish fed the LFD, HFD, or HFSP0.5 for 2 weeks, including (E) Sod2, (F) Gpx, and (G) Cat. (H) Representative histopathologic images of H&E-stained intestinal sections in zebrafish intraperitoneally injected with 4-hydroxy-TEMPO, a membrane-permeable radical scavenger. The scale bar, 50 μm. (I) Histological score measuring the severity of the intestinal damage of zebrafish intraperitoneally injected with 4-hydroxy-TEMPO. Values are means ± SEM (n = 5–12). Means without a common letter are significantly different (p < 0.05). Duncan's test. |
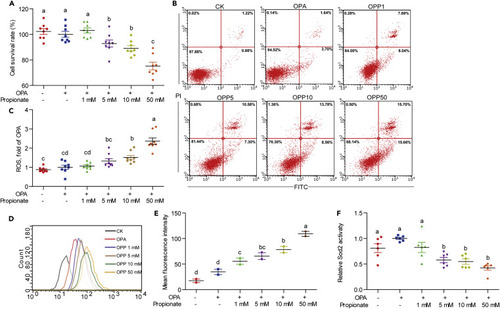
(A) Cell survival rate in ZF4 cells treated with OPA or a mixture of OPA with increasing concentrations of propionate for 24 h (n = 8). (B) Representative plot of cell apoptotic rate in ZF4 cells treated with OPA or a mixture of OPA with increasing concentrations of propionate (OPP1, OPP5, OPP10, and OPP50) for 24 h. (C) Relative amount of cellular ROS acquired by a fluorescence microplate reader between ZF4 cells treated with OPA or a mixture of OPA with increasing concentrations of propionate for 24 h (n = 8). (D) DCFH-DA histogram acquired by flow cytometry between ZF4 cells treated with OPA or mixtures of OPA with increasing concentrations of propionate for 24 h. (E) Mean fluorescence intensity of DCFH-DA in ZF4 cells treated with OPA or a mixture of OPA with increasing concentrations of propionate for 24 h (n = 2). (F) Sod2 activity in ZF4 cells treated with OPA or a mixture of OPA with increasing concentrations of propionate for 24 h (n = 6). Values are means ± SEM. Means without a common letter are significantly different (p < 0.05). Duncan's test. |
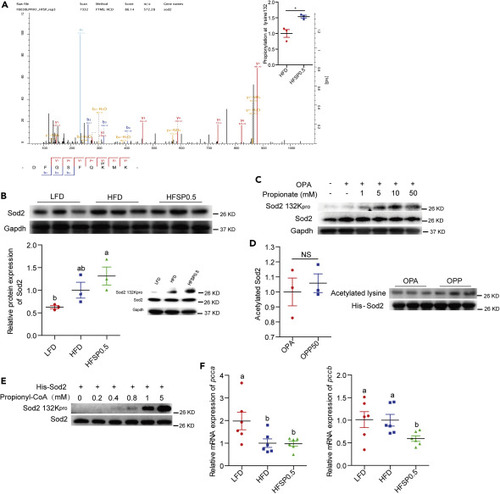
(A) HPLC-MS/MS spectra of an Sod2 peptide bearing propionylation (DFGSFQK+57.0901MN). (B) A representative western blotting showing patterns of Sod2 expression and Sod2 propionylation at the K132 and quantification of intestinal Sod2 protein level in zebrafish fed LFD, HFD, or HFSP0.5 for 2 weeks (n = 3). (C) A representative western blotting showing patterns of Sod2 expression and Sod2 propionylation at the K132 in ZF4 cells treated with OPA or OPP. (D) Western blotting showing the pattern of his-Sod2 acetylation purified from OPA- or OPP-treated HEK293 cells (n = 3). (E) A representative western blotting showing the pattern of his-Sod2 propionylation at K132 incubated with the indicated concentrations of propionyl-CoA. (F) The mRNA expression of genes encoding subunits of intestinal Pcc, an enzyme catalyzing the carboxylation of propionyl-CoA, in zebrafish fed HFD or HFSP0.5 for 2 weeks (n = 6). Values are means ± SEM. A and D were analyzed by Student's t test, ∗, p < 0.05, NS, not significant. B and F were analyzed by Duncan's test and means without a common letter are significantly different (p < 0.05). |

(A) A representative western blotting showing that overexpression of WT Sod2 and Sod2 K132R/Q compensated Sod2 level in ZF4 cells (with endogenous Sod2 knockdown). (B–D) (B) Sod2 activity, (C) ROS level, and (D) cell survival rate in ZF4 cells transfecting with WT Sod2 or Sod2 K132R/Q mutants (with endogenous Sod2 knockdown) (n = 6–8). (E) Sod2 activity and (F) ROS level in ZF4 cells treated with OPA or OPP (50 mM propionate), which were transfected with WT Sod2 and Sod2 K132R in advance (without Sod2 knockdown) (n = 4–8). Values are means ± SEM. Means without a common letter are significantly different (p < 0.05). Duncan's test. CK, 5% BSA. |
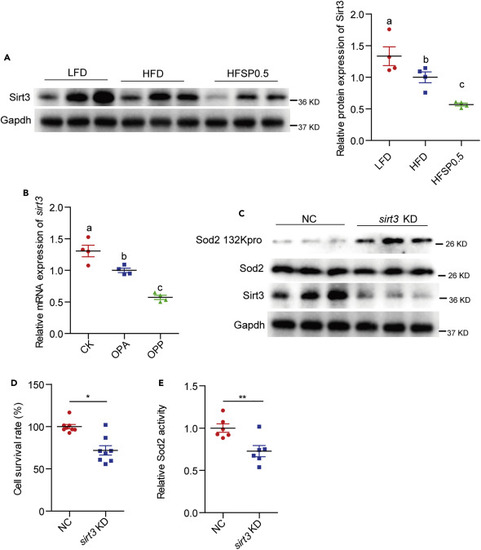
(A) A representative western blotting showing Sirt3 expression and quantification of intestinal Sirt3 protein level in zebrafish fed LFD, HFD, or HFSP0.5 for 2 weeks (n = 4). (B) The mRNA expression of sirt3 in ZF4 cells treated with OPA or OPP50 for 24 h (n = 4). (C) A representative western blotting showing the propionylation of Sod2 at the 132 lysine site in ZF4 cells upon sirt3 knockdown. (D) Cell survival rate in ZF4 cells with sirt3 knockdown (n = 8). (E) Sod2 activity in ZF4 cells with sirt3 knockdown (n = 6). Values are mean ± SEM. A and B were analyzed by Duncan's test, and means without a common letter are significantly different (p < 0.05). D and E were analyzed by Student's t test, ∗, p < 0.05, ∗∗, p < 0.01. |
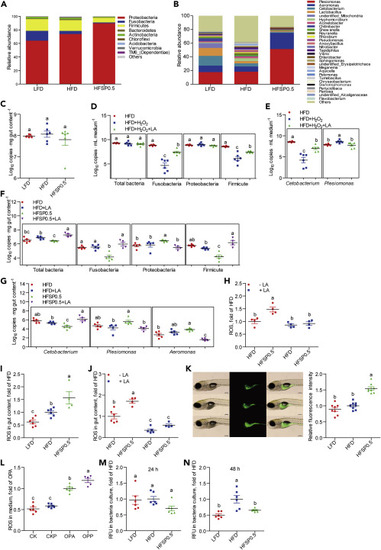
(A) The composition of gut microbiota at phylum level in 1-month-old zebrafish fed the LFD, HFD, or HFSP0.5 (n = 6). (B) The composition of gut microbiota at genus level in 1-month-old zebrafish fed the LFD, HFD, or HFSP0.5 (n = 6). (C) The number of total bacteria in gut content collected from 1-month-old zebrafish fed the LFD, HFD, or HFSP0.5 (Log10 16S rDNA gene copies . mg gut content−1) (n = 6). (D) The number of total bacteria, Fusobacteria, Proteobacteria, and Firmicutes after incubation in GAM with or without H2O2 for 48 h (Log10 16S rDNA gene copies . mL medium−1) (n = 6). (E) The number of Cetobacterium and Plesiomonas after incubation in GAM with or without H2O2 for 48 h (n = 6). (F) The number of total bacteria, Fusobacteria, Proteobacteria, and Firmicutes in gut content collected from 1-month-old zebrafish fed HFSP0.5 with or without supplementation of LA (Log10 16S rDNA gene copies . mg gut content−1) (n = 4–5). (G) The numbers of Cetobacterium, Plesiomonas, and Aeromonas in gut content collected from 1-month-old zebrafish fed HFSP0.5 with or without supplementation of LA (Log10 16S rDNA gene copies . mg gut content−1) (n = 4–5). (H) ROS level in the intestine collected from zebrafish fed the HFD or HFSP0.5 supplemented with LA (n = 4). (I) ROS level in the gut content collected from zebrafish fed the LFD, HFD, or HFSP0.5 (n = 4–6). (J) ROS level in gut contents collected from zebrafish fed the HFD or HFSP0.5 supplemented with LA (n = 4–6). (K) ROS pattern in GF zebrafish fed the LFD, HFD, or HFSP0.5 for 1 week. The scale bar, 200 μm (n = 8). (L) ROS level in the medium of ZF4 cells treated with OPA or OPP (50 mM propionate) for 24 h (n = 6). (M and N) ROS generated by in vitro cultured gut microbiota derived from LFD-, HFD-, or HFSP0.5-fed zebrafish at (M) 24 h and (N) 48 h (n = 6). Values are means ± SEM. Means without a common letter are significantly different (p < 0.05). Duncan's test. |
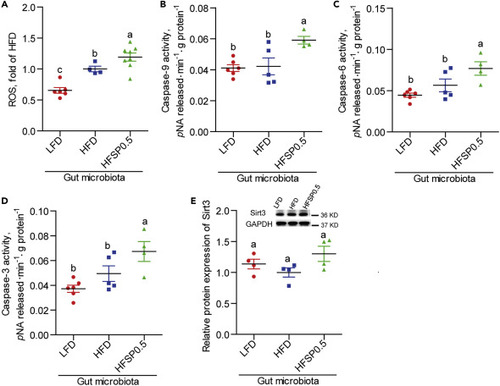
(A) The ROS level in GF zebrafish colonized with gut microbiota from 1-month-old zebrafish fed the LFD, HFD, or HFSP0.5 (n = 4–8). (B–D) (B) Caspase-9, (C) caspase-6, and (D) caspase-3 activities in GF zebrafish colonized with gut microbiota from 1-month-old zebrafish fed the LFD, HFD, or HFSP0.5 (n = 4–6). (E) Quantification of Sirt3 protein level in GF zebrafish transferred with gut microbiota from 1-month-old zebrafish fed the LFD, HFD, or HFSP0.5 (n = 4). Values are means ± SEM. Means without a common letter are significantly different ( p < 0.05). Duncan's test. |