
Image
|
Figure Caption
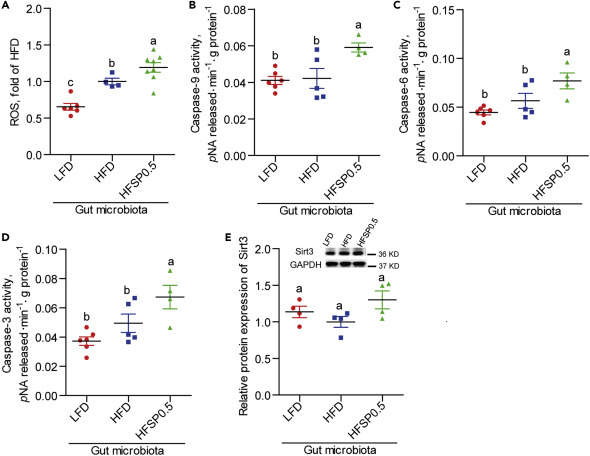
Fig. 8 (A) The ROS level in GF zebrafish colonized with gut microbiota from 1-month-old zebrafish fed the LFD, HFD, or HFSP0.5 (n = 4–8). (B–D) (B) Caspase-9, (C) caspase-6, and (D) caspase-3 activities in GF zebrafish colonized with gut microbiota from 1-month-old zebrafish fed the LFD, HFD, or HFSP0.5 (n = 4–6). (E) Quantification of Sirt3 protein level in GF zebrafish transferred with gut microbiota from 1-month-old zebrafish fed the LFD, HFD, or HFSP0.5 (n = 4). Values are means ± SEM. Means without a common letter are significantly different ( p < 0.05). Duncan's test.
Acknowledgments
This image is the copyrighted work of the attributed author or publisher, and
ZFIN has permission only to display this image to its users.
Additional permissions should be obtained from the applicable author or publisher of the image.
Full text @ iScience