
Fig. 7
- ID
- ZDB-FIG-220107-14
- Publication
- Ding et al., 2021 - Propionate induces intestinal oxidative stress via Sod2 propionylation in zebrafish
- Other Figures
- All Figure Page
- Back to All Figure Page
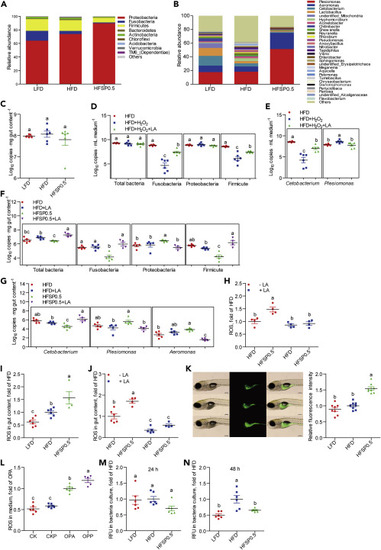
(A) The composition of gut microbiota at phylum level in 1-month-old zebrafish fed the LFD, HFD, or HFSP0.5 (n = 6). (B) The composition of gut microbiota at genus level in 1-month-old zebrafish fed the LFD, HFD, or HFSP0.5 (n = 6). (C) The number of total bacteria in gut content collected from 1-month-old zebrafish fed the LFD, HFD, or HFSP0.5 (Log10 16S rDNA gene copies . mg gut content−1) (n = 6). (D) The number of total bacteria, Fusobacteria, Proteobacteria, and Firmicutes after incubation in GAM with or without H2O2 for 48 h (Log10 16S rDNA gene copies . mL medium−1) (n = 6). (E) The number of Cetobacterium and Plesiomonas after incubation in GAM with or without H2O2 for 48 h (n = 6). (F) The number of total bacteria, Fusobacteria, Proteobacteria, and Firmicutes in gut content collected from 1-month-old zebrafish fed HFSP0.5 with or without supplementation of LA (Log10 16S rDNA gene copies . mg gut content−1) (n = 4–5). (G) The numbers of Cetobacterium, Plesiomonas, and Aeromonas in gut content collected from 1-month-old zebrafish fed HFSP0.5 with or without supplementation of LA (Log10 16S rDNA gene copies . mg gut content−1) (n = 4–5). (H) ROS level in the intestine collected from zebrafish fed the HFD or HFSP0.5 supplemented with LA (n = 4). (I) ROS level in the gut content collected from zebrafish fed the LFD, HFD, or HFSP0.5 (n = 4–6). (J) ROS level in gut contents collected from zebrafish fed the HFD or HFSP0.5 supplemented with LA (n = 4–6). (K) ROS pattern in GF zebrafish fed the LFD, HFD, or HFSP0.5 for 1 week. The scale bar, 200 μm (n = 8). (L) ROS level in the medium of ZF4 cells treated with OPA or OPP (50 mM propionate) for 24 h (n = 6). (M and N) ROS generated by in vitro cultured gut microbiota derived from LFD-, HFD-, or HFSP0.5-fed zebrafish at (M) 24 h and (N) 48 h (n = 6). Values are means ± SEM. Means without a common letter are significantly different (p < 0.05). Duncan's test. |