
|
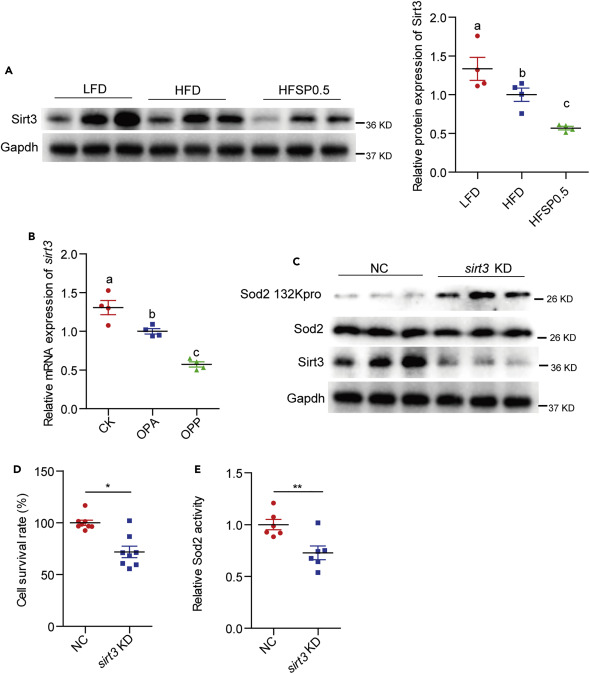
Fig. 6 (A) A representative western blotting showing Sirt3 expression and quantification of intestinal Sirt3 protein level in zebrafish fed LFD, HFD, or HFSP0.5 for 2 weeks (n = 4). (B) The mRNA expression of sirt3 in ZF4 cells treated with OPA or OPP50 for 24 h (n = 4). (C) A representative western blotting showing the propionylation of Sod2 at the 132 lysine site in ZF4 cells upon sirt3 knockdown. (D) Cell survival rate in ZF4 cells with sirt3 knockdown (n = 8). (E) Sod2 activity in ZF4 cells with sirt3 knockdown (n = 6). Values are mean ± SEM. A and B were analyzed by Duncan's test, and means without a common letter are significantly different (p < 0.05). D and E were analyzed by Student's t test, ∗, p < 0.05, ∗∗, p < 0.01.