
|
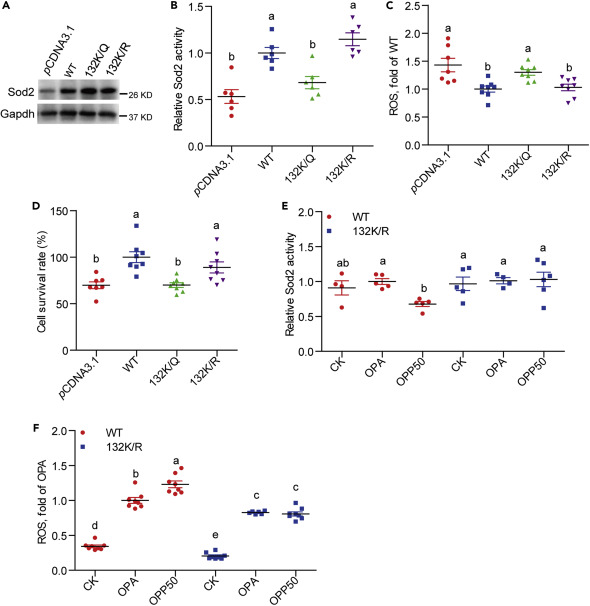
Fig. 5 (A) A representative western blotting showing that overexpression of WT Sod2 and Sod2 K132R/Q compensated Sod2 level in ZF4 cells (with endogenous Sod2 knockdown). (B–D) (B) Sod2 activity, (C) ROS level, and (D) cell survival rate in ZF4 cells transfecting with WT Sod2 or Sod2 K132R/Q mutants (with endogenous Sod2 knockdown) (n = 6–8). (E) Sod2 activity and (F) ROS level in ZF4 cells treated with OPA or OPP (50 mM propionate), which were transfected with WT Sod2 and Sod2 K132R in advance (without Sod2 knockdown) (n = 4–8). Values are means ± SEM. Means without a common letter are significantly different (p < 0.05). Duncan's test. CK, 5% BSA.