
Fig. 3
- ID
- ZDB-FIG-220107-10
- Publication
- Ding et al., 2021 - Propionate induces intestinal oxidative stress via Sod2 propionylation in zebrafish
- Other Figures
- All Figure Page
- Back to All Figure Page
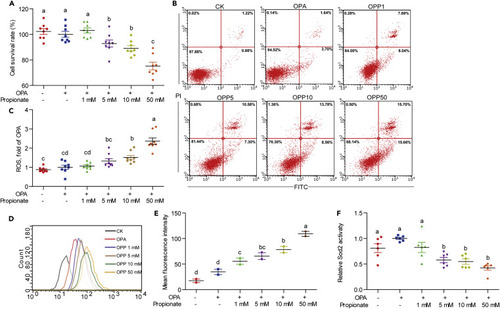
(A) Cell survival rate in ZF4 cells treated with OPA or a mixture of OPA with increasing concentrations of propionate for 24 h (n = 8). (B) Representative plot of cell apoptotic rate in ZF4 cells treated with OPA or a mixture of OPA with increasing concentrations of propionate (OPP1, OPP5, OPP10, and OPP50) for 24 h. (C) Relative amount of cellular ROS acquired by a fluorescence microplate reader between ZF4 cells treated with OPA or a mixture of OPA with increasing concentrations of propionate for 24 h (n = 8). (D) DCFH-DA histogram acquired by flow cytometry between ZF4 cells treated with OPA or mixtures of OPA with increasing concentrations of propionate for 24 h. (E) Mean fluorescence intensity of DCFH-DA in ZF4 cells treated with OPA or a mixture of OPA with increasing concentrations of propionate for 24 h (n = 2). (F) Sod2 activity in ZF4 cells treated with OPA or a mixture of OPA with increasing concentrations of propionate for 24 h (n = 6). Values are means ± SEM. Means without a common letter are significantly different (p < 0.05). Duncan's test. |