
- Title
-
A novel inhibitor rescues cerebellar defects in a zebrafish model of Down Syndrome-associated kinase Dyrk1A overexpression
- Authors
- Buchberger, A., Schepergerdes, L., Flaßhoff, M., Kunick, C., Köster, R.W.
- Source
- Full text @ J. Biol. Chem.
|

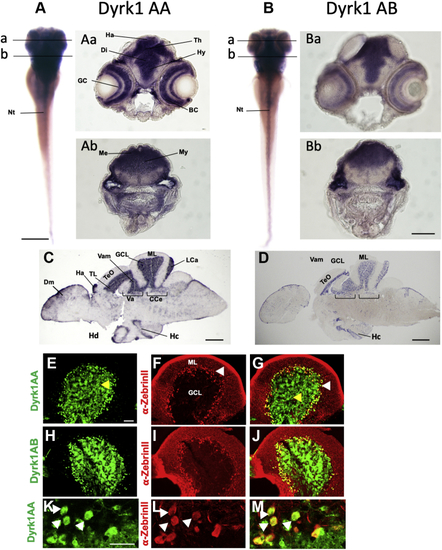
EXPRESSION / LABELING:
|
|
|
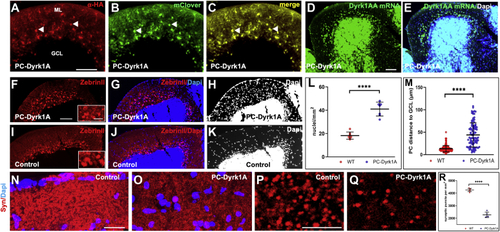
A compromised PC layer in adult PC-Dyrk1A brains is accompanied by a strong loss of synaptic puncta. A–C, the expression of Dyrk1A and mClover persists in adult brains of PC-Dyrk1A transgenic fish as shown on frozen cerebellar sagittal sections stained with (A) αHA or (B) mClover expression. C, the overlay of the images documents the coexpression of hDyrk1A and the fluorescent mClover protein. dyrk1aa in situ hybridization (D) with DAPI counterstaining (E) demonstrated that the endogenous expression of zebrafish dyrk1aa is maintained in the cerebellum of adult PC-Dyrk1A fish. F–K, PC-specific ZebrinII immunohistochemistry with DAPI counterstaining on adult frozen sagittal cerebellar sections of PC-Dyrk1A (F–H) and PC-RFP controls (I–K). Purkinje cells are no longer found in an orderly fashion between granule cell layer (GCL) and the molecular layer (ML) in PC-Dyrk1A fish as in controls but appear scattered throughout the ML (A–C, white arrowheads). This is confirmed by quantitative analysis of (L) cell nucleus density in the ML and (M) the distance of PCs to the GCL (unpaired two-tailed t test, p < 0.0001). Compared with controls (N and P), the synaptic density in the molecular layer was reduced in PC-Dyrk1A brains (O and Q) shown by anti-Synaptophysin immunohistochemistry counterstained with DAPI and quantified by counting the density of synaptic puncta (R) (unpaired two-tailed t test, p < 0.0001). Values are the means ± SD (error bars). Anterior is to the left and dorsal up. The scale bar represents 100 μm (A–K), 20 μm (insets F and I), 20 μm (N and O), and 5 μm (P and Q). DAPI, 4’,6-diamidino-2-phenylindole; GCL, granule cell layer; ML, molecular layer. ∗∗∗∗p < 0.0001. |
|
|