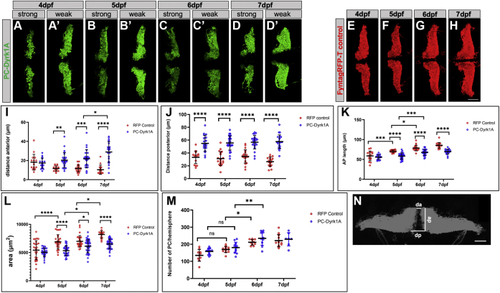
hDyrk1A overexpression in PCs impairs morphology of the PC layer.A–H, PC layer of either PC-Dyrk1A larvae displaying green mClover fluorescence or PC-RFP control larvae with red fluorescence between 4 and 7 dpf. Dorsal view (anterior to the left) of left and right PC hemispheres of different PC-Dyrk1A larvae from the same developmental stage with either strong (A–D) or mild (A’–D’) phenotype in PC layer morphology and corresponding controls (E–H). I–M, quantification of morphological abnormalities from PC-RFP control (red) and PC-Dyrk1A (blue) larvae between 4 and 7 dpf (n = 12–19). Measurements of anterior (I) and posterior (J) distance between the two PC layer hemispheres, anterior–posterior length (K) and area (L) of individual hemispheres, as well as the numbers of PCs (M) per hemisphere. I–M, data are the mean ± SD (error bars). Statistical analysis was performed using two-way ANOVA, followed by Tukey's post hoc multiple comparisons test. I, interaction: F = 10.25, p < 0.0001; row factor: F = 1.725, p = 0.1642; column factor: F = 59.45. p < 0.0001. ∗p = 0.0437, ∗∗p = 0.0051, ∗∗∗p = 0.0004, and ∗∗∗∗p < 0.0001. J, interaction: F = 1.682, p = 0.1732; row factor: F = 0.8437, p = 0.4719; column factor: F = 59.45, p < 0.0001 and ∗∗∗∗ p < 0.0001. K, interaction: F = 4.523, p = 0.0045; row factor: F = 56.01, p < 0.0001; column factor: F = 80.41, p < 0.000. ∗p = 0.0272, ∗∗∗ RFP control 4 dpf versus 5 dpf RFP p = 0.002, ∗∗∗PC-Dyrk1A 5 dpf versus 6 dpf p = 0.0003, ∗∗∗∗ p < 0.0001. L, interaction: F = 4.035, p = 0.0081; row factor: F = 31.15, p < 0.0001; column factor: F = 56.54, p < 0.0001. ∗ PC-Dyrk1A 5 dpf versus 6 dpf p = 0.0486; ∗ RFP control versus PC-Dyrk1A 6 dpf p = 0.0272, ∗ RFP control 6 dpf versus 7 dpf p = 0.0104, ∗∗∗∗ p < 0.0001. M, interaction: F = 0.4441, p = 0.7221; row factor: F = 32.67, p < 0.0001; column factor: F = 6.727, p = 0.0113. ∗ RFP control 5 dpf versus 6 dpf 0.0321, ∗∗ PC-Dyrk1A 5 dpf versus 6 dpf p = 0.0017. N, schematic drawing to illustrate the positions of measurements quantified in panels I–K. Anterior to the left (A–H) and to the top (N), respectively. The scale bar represents 50 μm (A–H and N). ap, anterior–posterior length; da, distance anterior; dp, distance posterior; dpf, days post fertilization; Dyrk1A, dual-specificity tyrosine phosphorylation–regulated kinase 1A; PCs, Purkinje cells.
|
