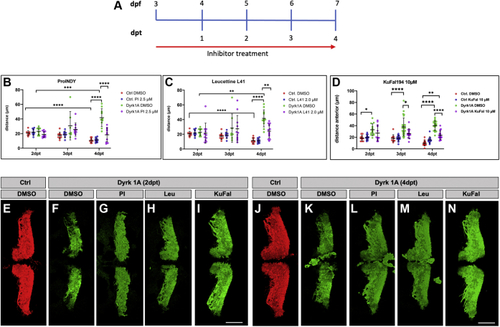
Dryk1A inhibitors rescue the morphological Purkinje cell layer impairments of PC-Dyrk1A larvae.A, scheme of inhibitor administration. Inhibitors dissolved in DMSO were diluted to the respective concentrations in 30% Danieau. 3 dpf larvae were treated for 4 days, and the inhibitor was changed daily. In vivo imaging of PC hemispheres of all groups was performed between 2 and 4 dpt. B–D, measurements of the anterior distance (μm) of the PC hemispheres for (B) ProINDY, (C) Leucettine L41, and (D) KuFal194 treated larvae. Each inhibitor test encompasses the following groups: PC-RFP control larvae treated with DMSO (Ctrl, DMSO), PC-RFP control larvae treated with inhibitor (Ctrl + inhibitor), PC-Dyrk1A larvae treated with DMSO (Dyrk1A DMSO), and PC-Dyrk1A larvae treated with inhibitor (Dyrk1A + inhibitor). B–D, data are the mean ± SD (error bars). Statistical analysis was performed using three-way ANOVA, followed by Tukey's post hoc multiple comparisons test. B, row factor: F = 0.9372 p = 0.3953, row factor (Ctrl DMSO Ctrl PI versus Dyrk1A DMSO Dyrk1A PI): F = 0.9372, p = 0.3953; row factor (Ctrl DMSO Dyrk1A DMSO versus Ctrl PI Dyrk1A PI): F = 10.47, p = 0.0017; row factor x (Ctrl DMSO Ctrl PI versus Dyrk1A DMSO Dyrk1A PI): F = 12.75, p < 0.0001; row factor x (Ctrl DMSO Dyrk1A DMSO versus Ctrl PI Dyrk1A PI): F = 4.843, p = 0.0099; row factor (Ctrl DMSO Ctrl PI versus Dyrk1A DMSO Dyrk1A PI) x (Ctrl DMSO Dyrk1A DMSO versus Ctrl PI Dyrk1A PI): F = 14.47, p = 0.0002; row factor x (Ctrl DMSO Ctrl PI versus Dyrk1A DMSO Dyrk1A PI) x (Ctrl DMSO Dyrk1A DMSO versus Ctrl PI Dyrk1A PI): F = 3.555, p = 0.0324. ∗∗∗p = 0.0003 and ∗∗∗∗p < 0.0001. C, row factor: F = 0.1570, p = 0.8549; row factor (Ctrl DMSO Ctrl L41 versus Dyrk1A DMSO Dyrk1A L41): F = 30.85, p < 0.0001; row factor (Ctrl DMSO Dyrk1A DMSO versus Ctrl L41 Dyrk1A L41): F = 2.139, p = 0.1466; row factor x (Ctrl DMSO Ctrl L41 versus Dyrk1A DMSO Dyrk1A L41): F = 9.839., p = 0.0001; row factor x (Ctrl DMSO Dyrk1A DMSO versus Ctrl L41 Dyrk1A L41): F = 2.441, p = 0.0921; row factor (Ctrl DMSO Ctrl L41 versus Dyrk1A DMSO Dyrk1A L41) x (Ctrl DMSO Dyrk1A DMSO versus Ctrl L41 Dyrk1A L41): F = 3.689, p = 0.0575; row factor x (Ctrl DMSO Ctrl L41 versus Dyrk1A DMSO Dyrk1A L41) x (Ctrl DMSO Dyrk1A DMSO versus Ctrl L41 Dyrk1A L41): F = 1.708, p = 0.1863. ∗∗Dyrk1A DMSO 2 dpt versus 4 dpt p = 0.0068; ∗∗Dyrk1A DMSO versus Dyrk1A L41 4 dpt p = 0.0065; ∗∗∗∗ p < 0.0001. D, row factor: F = 1.843, p = 0.1617; row factor (Ctrl DMSO Ctrl KuFal194 versus Dyrk1A DMSO Dyrk1A KuFal194): F = 108.3, p < 0.0001; row factor (Ctrl DMSO Dyrk1A DMSO versus Ctrl KuFal194 Dyrk1A KuFal194): F = 10.35, p = 0.0016; row factor x (Ctrl DMSO Ctrl KuFal194 versus Dyrk1A DMSO Dyrk1A KuFal194) F = 3.088, p = 0.0482; row factor x (Ctrl DMSO Dyrk1A DMSO versus Ctrl KuFal194 Dyrk1A KuFal194): F = 0.5474, p = 0.5795; row factor (Ctrl DMSO Ctrl KuFal194 versus Dyrk1A DMSO Dyrk1A KuFal194) x (Ctrl DMSO Dyrk1A DMSO versus Ctrl KuFal194 Dyrk1A KuFal194): F = 23.42, p < 0.0001; row factor x (Ctrl DMSO Ctrl KuFal194 versus Dyrk1A DMSO Dyrk1A KuFal194) x (Ctrl DMSO Dyrk1A DMSO versus Ctrl KuFal194 Dyrk1A KuFal194): F = 2.762, p = 0.0661. ∗Ctrl DMSO versus Dyrk1A DMSO 2 dpt p = 0.0120; ∗Dyrk1A DMSO versus Dyrk1A KuFal 10 μM 3 dpt p = 0.0111; ∗∗p = 0.0013; ∗∗∗∗p < 0.0001. E–N, representative images of PC hemispheres of reconstructed confocal laser scanning z-stacks for (E and J) PC-RFP DMSO controls, (F and K) PC-Dyrk1A DMSO-treated larvae, (G and L) ProINDY-treated larvae, (H and M) Leucettine L41-treated larvae, and (I and N) KuFal194-treated larvae. E–I, 2 dpt and (J–N) 4 dpt. The scale bar represents 50 μm (E–N). dpt, days post treatment; DMSO, dimethyl sulfoxide; Dyrk1A, dual-specificity tyrosine phosphorylation–regulated kinase 1A; PCs, Purkinje cells.
|
