Knockdown of hspg2 is associated with craniofacial phenotypes. a-b Random control (RC) and morphant (MO) groups were stained with Alcian blue at 5 days post fertilization (DPF) (N = 20 per group). Ceratohyal, Meckel’s cartilage, and the palatoquadrate are labeled as the abbreviations (ch), (mc), and (pq) respectively. The black box on each of the images shows the mandibular jaw joint. a’-b′ The mandibular jaw joint enclosed by the black box at 40X magnification. a’ shows a red wedge indicating the normally developed gap in the mandibular jaw joint and b′ shows two red arrows which indicate an abnormally tight proximity between the two sides of the joint. c The distance between the top of the Meckel’s cartilage and top of the ceratohyal was measured across both groups (N = 20 per group) as a readout for micrognathia. Mandibular length was normalized to the random control (RC) group. *p = 0.025

nkx3.2 expression is decreased in hspg2 morphants. a-b Whole mount in situ hybridization (ISH) was performed to detect the expression of nkx3.2 at the 2 days post fertilization (DPF) stage. Embryos were injected as described in the methods section and subjected to ISH to detect nkx3.2 expression in the developing jaw joint region. Black arrows indicate the expression of nkx3.2. There were N = 18 in the random control (RC) group and N = 14 larvae in the hspg2 morphants (MO) group. a’-b′ shows regions of nkx3.2 expression. Number one and attached arrow indicate the first pharyngeal arch and number five and attached arrow indicate the fifth pharyngeal arch. c qPCR was performed to detect the expression of nkx3.2 at 4 DPF on two independent occasions, each represented by a gray dot. Each biological replicate had a minimum of 7 larvae/group and a total n = 15 across both replicates. **p = 0.004

EXPRESSION / LABELING:
Gene:
Fish:
Knockdown Reagent:
Anatomical Terms:
Stage Range: Long-pec to Day 4
PHENOTYPE:
Fish:
Knockdown Reagent:
Observed In:
Stage Range: Long-pec to Day 4

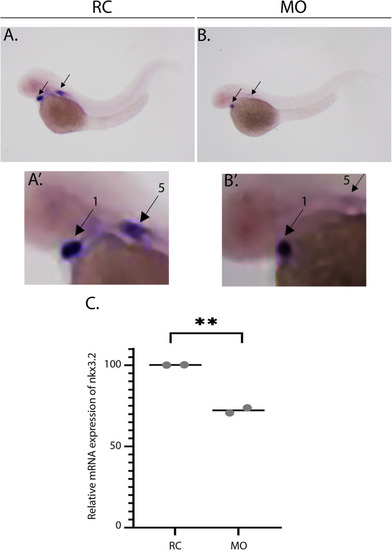
Early neural crest cell (NCC) migration and specification are normal in morphants. a-a’ Non-injected (NI) Tg(sox10:TagRFP) larvae and hspg2 morpholino injected Tg(sox10:TagRFP) larvae (MO) (N = 6 and N = 4, respectively) were staged and fixed at the 18-somite stage. Images are scaled at 200 μm and demonstrate two lateral streams of Sox10+ migrating NCCs. b-b′ NI and MO larvae (N = 8 and N = 16 respectively) were staged and fixed at the Prim-5 stage. Images are scaled at 200 μm and demonstrate Sox10+ NCCs in the pharyngeal arches. No significant changes were found between the two groups at either timepoint. Schematic represents the two migratory NCC streams in a zebrafish larvae at 18 somites and the localization of the CNCCs in the four pharyngeal arches at the Prim-5 stage

PHENOTYPE:
Fish:
Knockdown Reagent:
Observed In:
Stage Range: 14-19 somites to Prim-5

dlx2a expression is normal in morphants. a-c Whole mount in situ hybridization (ISH) was performed to detect the expression of dlx2a at the Prim-5 stage (N = 12 larvae in random control (RC) group, and N = 11 larvae in hspg2 morphant (MO) group). Embryos were injected as described in the methods section and subjected to ISH to detect dlx2a expression in the pharyngeal arches labeled by black arrows. d qPCR was performed to detect the expression of dlx2a. Total RNA was isolated from RC and hspg2 MO samples (N = 10 per group); error bars represent the standard deviation of technical replicates obtained from a pool of 10 embryos/group

EXPRESSION / LABELING:
Gene:
Fish:
Knockdown Reagent:
Anatomical Terms:
Stage: Prim-5
PHENOTYPE:
Fish:
Knockdown Reagent:
Observed In:
Stage: Prim-5

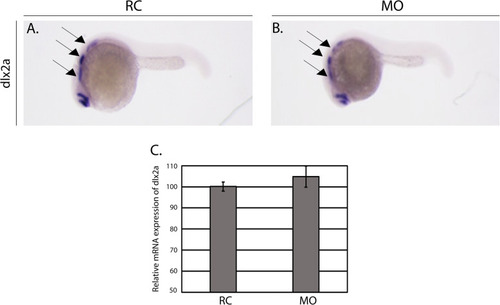
The number of Sox10+ cells is increased in morphants at 3 DPF. a-bTg(sox10:TagRFP) random control (RC) and morphant (MO) larvae (N = 10 per group) were mounted in agarose and confocal images were taken at 3 days post fertilization (DPF). c shows the representative region where cells were quantified with a corresponding schematic showing the parameters (3 rows left, 5 rows right). c′ Average number of Sox10+ cells counted across both groups (N = 10 per group) at 3 DPF. P-value pertains to the statistically significant difference between the RC group and the MOs (*p = 0.04). d qPCR expression of sox10 (N = 24 total) in RC and MO groups at 3 DPF (***p = 0.0005). qPCR was performed on two independent occasions, each represented by a gray dot. Each biological replicate had a minimum of 12 larvae/group for a total n = 24

EXPRESSION / LABELING:
Genes:
Fish:
Knockdown Reagent:
Anatomical Terms:
Stage: Protruding-mouth
PHENOTYPE:
Fish:
Knockdown Reagent:
Observed In:
Stage: Protruding-mouth

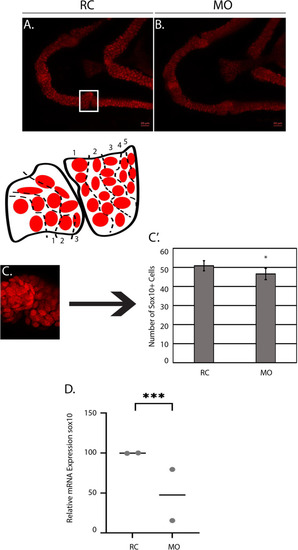
The number of Sox10+ cells is decreased in morphants at 4 DPF. a-bTg(sox10:TagRFP) random control (RC) and morphant (MO) larvae (N = 10 per group) were mounted in agarose and confocal images were taken at 4 days post fertilization (DPF). c shows the representative region where cells were quantified with a corresponding schematic showing the parameters (3 rows left, 5 rows right). c′ Average number of Sox10+ cells counted across both groups N = 10 per group) at 4 DPF. P-value pertains to the statistically significant difference between the RC group and the MO group (***p = 0.0002). d qPCR demonstrating the expression of sox10 (N = 15 total) in RC and MO groups at 4 DPF (**p = 0.005). qPCR was performed on two independent occasions (biological replicates), each represented by a gray dot. Each biological replicate had a minimum of 7 larvae/group and a total n = 15

EXPRESSION / LABELING:
Genes:
Fish:
Knockdown Reagent:
Anatomical Terms:
Stage: Day 4

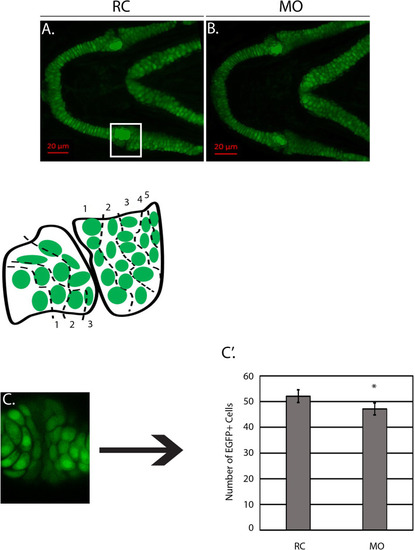
The number of Col2a1a+ cells is decreased at 4 DPF. a-bTg(col2a2a:EGFP) random control (RC) and morphant (MO) larvae (N = 10 per group) were mounted in agarose and confocal images were taken at 4 days post fertilization (DPF). c shows the representative region where cells were quantified with a corresponding schematic showing the parameters (3 rows left, 5 rows right). c′ Average number of Col2a1a+ cells counted across both groups (N = 10 per groups) at 4 DPF. P-value pertains to the statistically significant difference between the RC group and the MOs (***p = 1.44x− 05)

Acknowledgments
This image is the copyrighted work of the attributed author or publisher, and ZFIN has permission only to display this image to its users. Additional permissions should be obtained from the applicable author or publisher of the image. Full text @ BMC Dev. Biol.