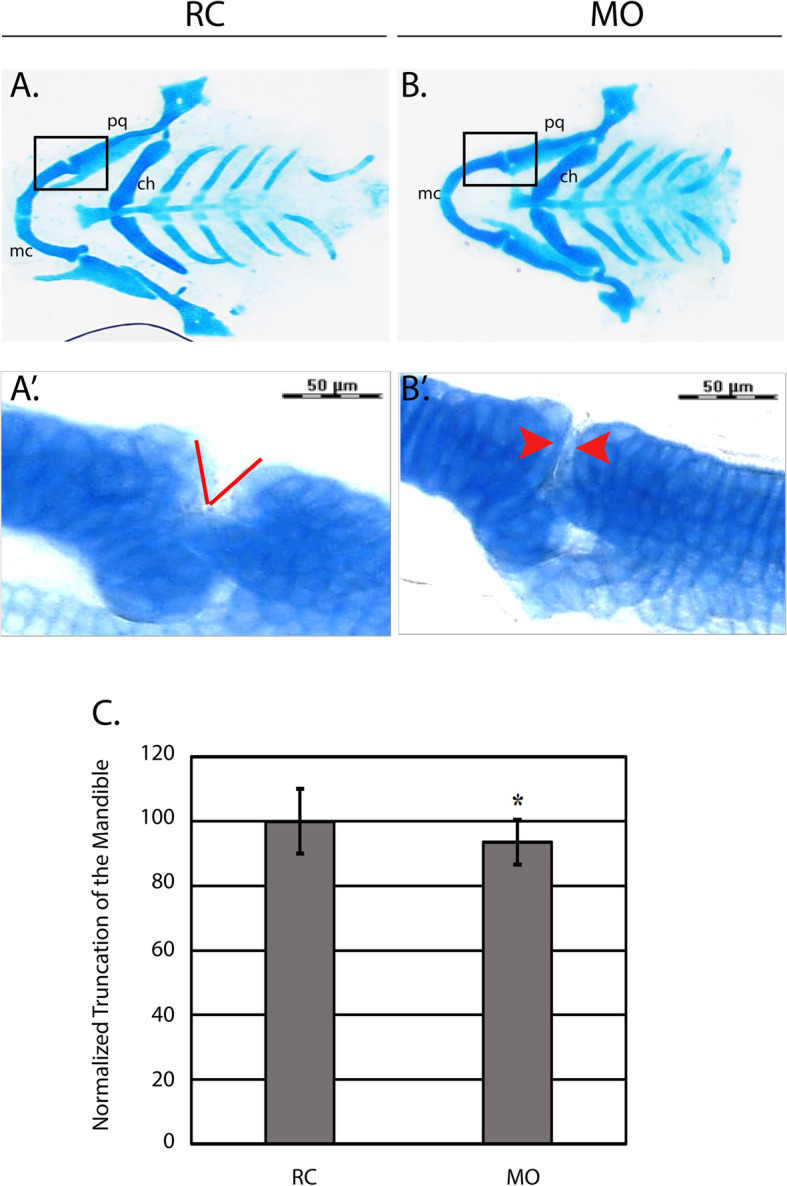
IMAGE

Fig. 1

ID
ZDB-IMAGE-210311-8
Source
Figures for Castellanos et al., 2021
Image
Figure Caption

Fig. 1

Knockdown of hspg2 is associated with craniofacial phenotypes. a-b Random control (RC) and morphant (MO) groups were stained with Alcian blue at 5 days post fertilization (DPF) (N = 20 per group). Ceratohyal, Meckel’s cartilage, and the palatoquadrate are labeled as the abbreviations (ch), (mc), and (pq) respectively. The black box on each of the images shows the mandibular jaw joint. a’-b′ The mandibular jaw joint enclosed by the black box at 40X magnification. a’ shows a red wedge indicating the normally developed gap in the mandibular jaw joint and b′ shows two red arrows which indicate an abnormally tight proximity between the two sides of the joint. c The distance between the top of the Meckel’s cartilage and top of the ceratohyal was measured across both groups (N = 20 per group) as a readout for micrognathia. Mandibular length was normalized to the random control (RC) group. *p = 0.025

Figure Data
Acknowledgments
This image is the copyrighted work of the attributed author or publisher, and ZFIN has permission only to display this image to its users. Additional permissions should be obtained from the applicable author or publisher of the image. Full text @ BMC Dev. Biol.