
- Title
-
Genetic disruption of zebrafish mab21l1 reveals a conserved role in eye development and affected pathways
- Authors
- Seese, S.E., Deml, B., Muheisen, S., Sorokina, E., Semina, E.V.
- Source
- Full text @ Dev. Dyn.
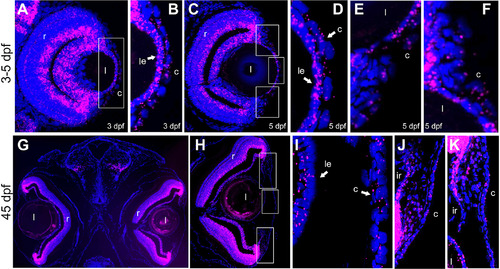
Expression pattern of mab21l1 in 3-, 5-, and 45-dpf zebrafish eye. RNA-scope analysis of mab21l1 (magenta) in 3-dpf, A and B, 5-dpf, C-F, and 45-dpf, G-K, transverse sections. At all stages, mab21l1 is expressed in the cornea (c) (both central, B, D, I, and peripheral, E, F, J, K), lens (l) (specifically, anterior lens epithelium [le]), and retina (r), A-K, as well as dorsal and ventral iris (ir) and iridocorneal angle at 45-dpf, J, K. DAPI staining indicates cell nuclei (blue). The boxed regions in, A, C, and H are shown in enlarged forms in, B, D-F, and I-K, respectively EXPRESSION / LABELING:
|
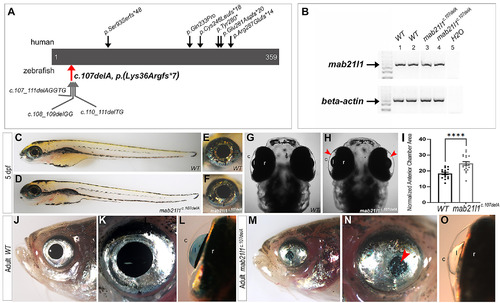
MAB21L1/mab21l1 variants and gross phenotypic analysis of mab21l1 deficient fish. A, Schematic of known human MAB21L1 pathogenic variants (top) and zebrafish mab21l1 alleles generated in this study (bottom). The red arrow indicates the zebrafish line chosen for detailed phenotypic characterization, mab21l1-c.107delA p.(Lys36Argfs*7). B, RT-PCR analysis of mab21l1 transcript expression comparing 5-dpf wild-type (lanes 1 and 2) and homozygous mab21l1-c.107delA p.(Lys36Argfs*7) (lanes 3 and 4) embryos. Beta-Actin was used as a loading control. C-I, Assessment of 5-dpf phenotypes. No gross abnormalities between wild-type, C,E, and mab21l1c.107delA embryos, D,F, were detected in lateral position. However, an increase in anterior chamber area in mab21l1c.107delA embryos (G, H, indicated by red arrowheads in, H) was detected in dorsal view. This finding was quantified, I, and found to be statistically significant (****P = .0001); error bars indicated SEM. J-O, Assessment of adult phenotypes (1–2 years of age). Smaller eyes with small/misshapen pupils, M, N, corneal opacities (N; red arrowhead), and irregularly shaped lens with keratolenticular adhesions, O, were observed. (c) cornea, (l) lens, (r) retina |

Histological analysis of homozygous mab21l1-c.107delA p.(Lys36Argfs*7) ocular phenotypes. A-N. H&E stained transverse, A-L, and sagittal, M and N, sections of wild-type, A,C,E,G,I,J,M, and mab21l1c.107delA mutant, B,D,F,H,K,L,N, eyes at 3-dpf, A,B, 5-dpf, C,D, 14-dpf, E,F, 1-mpf, G,H, and adult (1–2 years), I-N, stages. No difference was observed at 3-dpf between wild-types and mab21l1c.107delA, A and B. Beginning at 5-dpf and continuing at 14-hpf and 1-mpf, corneal thinning was observed in mab21l1c.107delA fish (D,F,H; indicated by red arrows). At 14-dpf, both the dorsal and ventral annular ligaments appear underdeveloped (indicated by red arrowhead), the dorsal and ventral iris appear short (red arrowhead outlined in black) and abnormal vasculature is present in the posterior segment (red asterisk) in mab21l1c.107delA mutants, F. At 1-mpf, the dorsal annular ligament remains underdeveloped (H, red arrowhead). In adult mab21l1c.107delA fish, K,L,N, abnormal corneal epithelium (red arrow) and fibrotic masses (K,L, red asterisk) in the anterior chamber, as well as abnormal lens epithelium (L, red arrowhead), small degenerative lenses, K-N, and abnormal lens material (N; red asterisks) were observed. (l) lens; (c) cornea; (r) retina; (ac) anterior chamber); (ir) iridocorneal region; (al) annular ligament; (pc) posterior chamber; (on) optic nerve. O, Measurements for total corneal thickness normalized to eye diameter for 5-dpf wild-type and mutants. Statistical significance is indicated by asterisks (**P = .0048); error bars indicate SEM PHENOTYPE:
|

Examination of the mab21l1-c.107delA p.(Lys36Argfs*7) ocular phenotype using immunohistochemistry, PAS staining and TUNEL fluorescence assays. A-I′, Wild-type, A-I, and mab21l1c.107delA mutant, A′-I′, transverse sections from 5-dpf, A-C, A′-C′), 1-mpf, D-F, D′-F′, and adults (1–2 years of age), G-I, G′-I′, were stained with DAPI (blue), cdh2 (green), and CKS (red). At 5-dpf, cdh2, and CKS staining highlights a thinner corneal epithelium (B′ vs. B) and stroma (C′ vs. C), correspondingly, observed in some mab21l1c.107delA embryos. At 1-mpf, thinning of the mab21l1c.107delA corneal epithelium (cdh2; E′ vs E) and stroma (CKS; F′ vs. F) becomes even more pronounced (red arrows in D′-F′). In mab21l1c.107delA adults, disorganized corneal layers with ectopic staining of CKS that can be detected throughout the outermost layer of the cornea (typically epithelium) are observed (I′ vs. I; red arrowhead in I′); additionally, lens degeneration is evident, highlighted by the absence of the cuboidal-shaped lens epithelial cells and disorganized cdh2 staining inside the lens (red arrowheads and asterisks in G′ and H′). (ce) corneal epithelium; (le) lens epithelium; (cs) corneal stroma; (cn) corneal endothelium. J-K′, Periodic acid-Schiff staining. Wild-type, J and K, and mab21l1c.107delA, J′,K′, adults (1–2 years of age) transverse sections were PAS stained to visualize mucin-secreting goblet cells. In wild-type adults, PAS-stained mucin-secreting goblet cells are restricted to the peripheral ocular tissue (J, black asterisks), and cannot be detected within the central cornea (K inset). In mab21l1c.107delA adults, PAS-stained goblet cells can be found at the ocular peripheries (J′, black asterisks), but can also be detected throughout the central cornea (J′ red asterisks, K′ inset red arrowheads). Red arrows in J′, K′ indicate abnormal corneal structures. (c) cornea; (l) lens; (r) retina, (ir) iridocorneal region; (ce) corneal epithelium; (cs) corneal stroma. L, Quantification of TUNEL assay. TUNEL positive cells were counted and percentage calculated to total DAPI-stained cells in cornea. Statistical significance is indicated by asterisks (1-mpf **P = .0021; Adult **P = .0081); error bars indicate SEM. M-O′. Representative images of TUNEL-stained wild-type, M,N,O, and mab21l1c.107delA mutant, M′, N′, O′, transverse sections at 5-dpf, M,M′, 1-mpf, N,N′, and adult, O, O′, eyes (red indicates dead cells). DAPI (blue) indicates cell nuclei. At all stages, an increase in TUNEL-stained cells was observed in mab21l1c.107delA mutant cornea (indicated by red arrows in, M′, N′ and O′, compared with wild-type. (c) cornea; (l) lens |
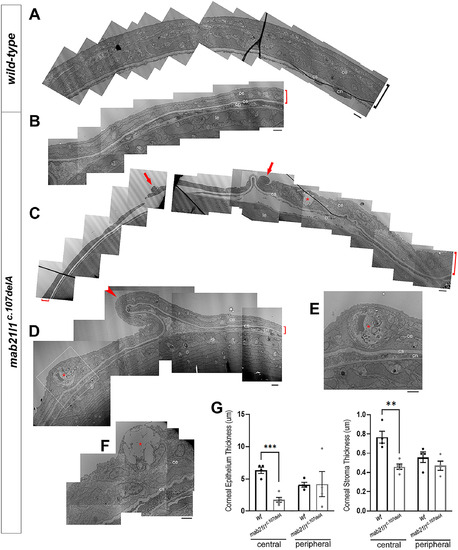
Electron microscopy analysis of cornea. Electron microscopy data for 14-dpf wild-type, A, and mab21l1c.107delA mutant, B-F, corneas. Please note thinner (B,C,D; red brackets) and unevenly folded (D; red arrowhead) corneas, especially epithelial layer, in mutants vs wild-type, as well as the high number of abnormal cells (cells undergoing cell death [red arrows in, C], goblet [red asterisks in, C, F], and possible rodlet cells [red asterisks in D, E inset]); bar = 2 μM; (ce) corneal epithelium; (cs) corneal stroma; (cn) corneal endothelium; (le) lens epithelium. G, Measurements of corneal epithelial and stromal thickness for central and peripheral regions comparing wild-type and mab21l1c.107delA fish at 14-dpf based on EM images. Statistical significance is indicated by asterisks (central epithelium ***P = .00012; central stroma **P = .0018); error bars indicate SEM PHENOTYPE:
|

RNA seq data from wild type and mab21l1 mutant embryos. A, Multidimensional Scaling Analysis. Multidimensional scaling (MDS) plot using the gene expression values of each sample. B, Volcano Plot of Expression Level of the up-regulated (yellow) and down-regulated (blue) transcripts. Log2 fold change and P-value obtained from the comparison between two groups plotted as volcano plot. (X-axis: log2 Fold Change, Y-axis: -log10 P-value). The dashed red line shows the P-value cutoff (P = .01) with points above the line having P-value <.01 and points below the line having P-value >.01. The vertical dashed blue lines show twofold changes. C, Heatmap for differentially expressed transcription factors and related genes. Zebrafish gene name and homologous human gene name are indicated, along with fold change. Gene names in red indicate transcripts validated by qRT-PCR. All transcripts except for krt17, loxa and tlr9, encode transcription factors (please see text). D, qRT-PCR analysis of select transcript (irf1a, irf1b, stat1b, elf3, dbx2, sox21b, krt17, loxa, and tlr9) level in RNA extracted from whole eyes of 3- and 5-dpf wild-type and mab21l1c.107delA embryos. The expression level in mutant embryos was normalized to wild-type expression at the same time-point. Bar graphs for 1, 2, and 3 indicate wild-type, 3-dpf mab21l1c.107delA and 5-dpf mab21l1c.107delA, respectively. Statistical significance is indicated by asterisks; * P ≤ .05, ** P ≤ .01, *** P ≤ .001, ****P ≤ .0001; error bars indicate SEM EXPRESSION / LABELING:
PHENOTYPE:
|