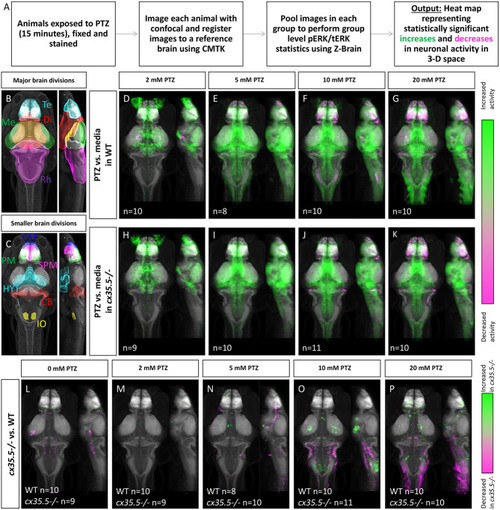
Whole-brain activity map showing significant regional differences in neuronal activity following various PTZ concentration exposure in wild-type and cx35.5-/- zebrafish larvae. (A) Schematic describing the data collection and analysis process for whole-brain activity mapping using the MAP-mapping technique. (B) Representative atlas depicting dorsal and lateral views of the 4 major brain divisions in zebrafish, showing the telencephalon (Te) in cyan, the diencephalon (Di) in red, the mesencephalon (Me) in green, and the rhombencephalon (Rh) in magenta. (C) Representative atlas depicting smaller brain regions mentioned in the text. The olfactory bulb (OLF) is labeled in blue, the pallium (PM) in green, the subpallium (SPM) in magenta, the hypothalamus (rostral, intermediate, and caudal) in cyan (HYT), the cerebellum (CB) in red, and the inferior olive (IO) in yellow. (D–G) Colors indicate ROIs with increased (green) or decreased (magenta) pERK/tERK ratio in wild-type PTZ treated groups compared to wild-type media only group. (D) 2 mM PTZ treated (n = 10) (E) 5 mM PTZ treated (n = 8) (F) 10 mM PTZ treated (n = 10) and (G) 20 mM PTZ treated (n = 10) vs. media (n = 10). (H–K) Colors indicate ROIs with increased (green) or decreased (magenta) pERK/tERK ratio in cx35.5-/- larvae PTZ treated groups compared to cx35.5-/- media only group. (H) 2 mM PTZ treated (n = 9) (I) 5 mM PTZ treated (n = 10) (J) 10 mM PTZ treated (n = 11) and (K) 20 mM PTZ treated (n = 10) vs. media (n = 9). (L–P) Colors indicate ROIs with increased (green) or decreased (magenta) pERK/tERK ratio in cx35.5-/- groups compared to corresponding wild-type groups. (L) Media treated (WT n = 10, MUT n = 9) (M) 2 mM PTZ treated (WT n = 10, MUT n = 9) (N) 5 mM PTZ treated (WT n = 8, MUT = 10) (O) 10 mM PTZ treated (WT n = 10, MUT n = 11) and (P) 20 mM PTZ treated (WT n = 10, MUT n = 10).

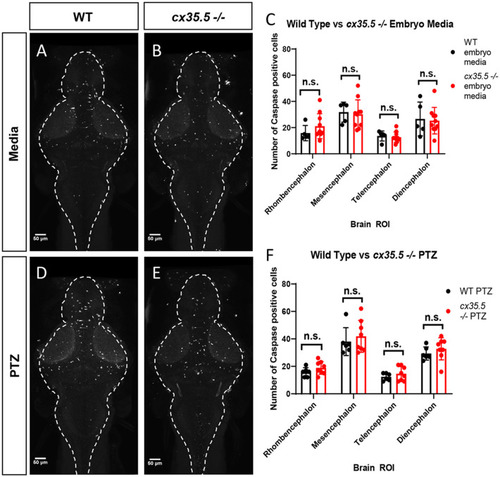
Activated caspase 3 positive cells by major brain division, comparing cx35.5-/- vs. wild type with and without PTZ. Representative sum stack projections of wild-type and cx35.5-/- larvae treated with media (A, B) or PTZ (D, E) and stained with anti-activated caspase-3. (C–F) Graphs depicting the number of activated caspase-3 positive cells in the rhombencephalon, mesencephalon, telencephalon, and diencephalon in wild-type (black) vs. cx35.5-/- (red) fish with treatment with (C) embryo medium (vehicle) or (F) PTZ. Data were analyzed using an unpaired t-test with Holm-Sidak's correction for multiple comparisons. Embryo medium (vehicle) treatment, wild type n = 5, cx35.5-/- n = 10. PTZ treatment, wild type n = 6, cx35.5-/- n = 8.

Whole-brain expression map of cx35.5-/- vs. wild-type zebrafish larvae immunostaining of anti-Cx36. (A,B) Anti-Cx36 staining in wild-type fish (A) and cx35.5-/- fish (B). (C) Whole-brain expression map showing increased expression in cx35.5-/- (cyan) and increased expression in wild type (red) showing the comparison of Cx36 expression between cx35.5-/- and wild type. Regions with increased Cx36 expression in cx35.5-/- are shown in cyan and regions with decreased Cx36 expression in cx35.5-/- are shown in red. Wild type n = 10, cx35.5-/- n = 7.

EXPRESSION / LABELING:
Antibody:
Fish:
Anatomical Term:
Stage: Day 6
PHENOTYPE:
Fish:
Observed In:
Stage: Day 6

Wild type whole-brain immunostaining Cx36 expression map in E3 vs. PTZ treated zebrafish larvae. Dorsal and lateral view of zebrafish larvae brain. Whole-brain expression of Cx36 using an anti-Cx36 antibody and tERK. Cyan indicates increases in Cx36 labeling in PTZ treated fish, and red indicated decreases in Cx36 labeling in PTZ treated fish. (A) After 30 min of 20 mM PTZ exposure (n = 10). (B) After 1 h of 20 mM PTZ exposure (n = 10). (C) 1-h recovery after PTZ is removed, n = 12. (D) 3 h of recovery after PTZ is removed, n = 12. (E) 6 h of recovery after PTZ is removed, n = 12. (F) 24 h of recovery after PTZ is removed, n = 10. (G) A graph depicting the number of activated caspase-3 positive cells in the rhombencephalon, mesencephalon, telencephalon, and diencephalon in wild-type fish with treatment with embryo medium (vehicle) (Black) or PTZ (Red). Data were analyzed using an unpaired t-test with Holm-Sidak's correction for multiple comparisons, n = 9.

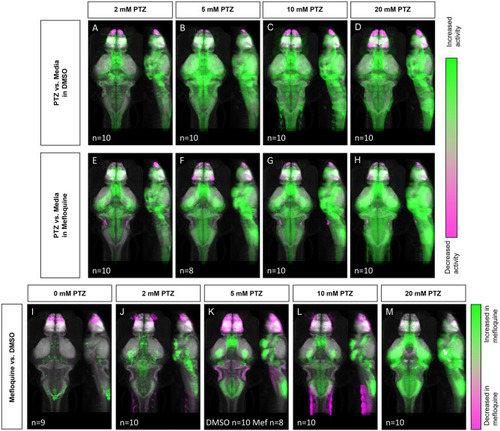
Whole-brain activity map showing significant regional differences following Cx36 blocking drug mefloquine and PTZ exposure in wild-type zebrafish larvae. Dorsal and lateral view of zebrafish larvae brain. (A–D) Images show regions with significantly increased (green) or decreased (magenta) activity compared to DMSO and embryo medium (vehicle) treated fish (n = 9). (A) 2 mM PTZ (n = 10). (B) 5 mM PTZ (n = 10) (C) 10 mM PTZ (n = 10). (D) 20 mM PTZ (n = 10). (E–H) Images show regions with significantly increased (green) or decreased (magenta) activity compared to mefloquine and embryo medium (vehicle) treated fish (n = 9). (E) 2 mM PTZ (n = 10). (F) 5 mM PTZ (n = 8). (G) 10 mM PTZ (n = 10). (H) 20 mM PTZ (n = 10). (I–M) Images show regions with significantly increased (green) or decreased (magenta) activity in mefloquine treated fish, compared to DMSO (vehicle) treated fish. (I) embryo medium (0 mM PTZ) (n = 9). (J) 2mM PTZ (n = 10). (K) 5 mM PTZ (DMSO n = 10, mefloquine n = 8) (L) 10 mM PTZ (n = 10). (M) 20 mM PTZ (n = 10). Mef: mefloquine.

Whole-brain activity of cx35.5-/- animals treated with mefloquine vs. DMSO. Dorsal and lateral views of zebrafish larvae brain are shown. Images show regions with significantly increased (green) or decreased (magenta) activity in cx35.5-/- animals treated with mefloquine compared to cx35.5-/- animals treated with DMSO. (A) Embryo medium (0 mM PTZ) (cx35.5-/- mefloquine n = 9, cx35.5-/- DMSO n = 11). (B) 5 mM PTZ (cx35.5-/- mefloquine n = 11, cx35.5-/- DMSO n = 11). (C) 20 mM PTZ (cx35.5-/- mefloquine n = 10, cx35.5-/- DMSO n = 7). Mef: mefloquine.

Acknowledgments
This image is the copyrighted work of the attributed author or publisher, and ZFIN has permission only to display this image to its users. Additional permissions should be obtained from the applicable author or publisher of the image. Full text @ Front. Mol. Neurosci.