IMAGE

Figure 5

ID
ZDB-IMAGE-210130-22
Source
Figures for Brunal et al., 2021
Image
Figure Caption

Figure 5

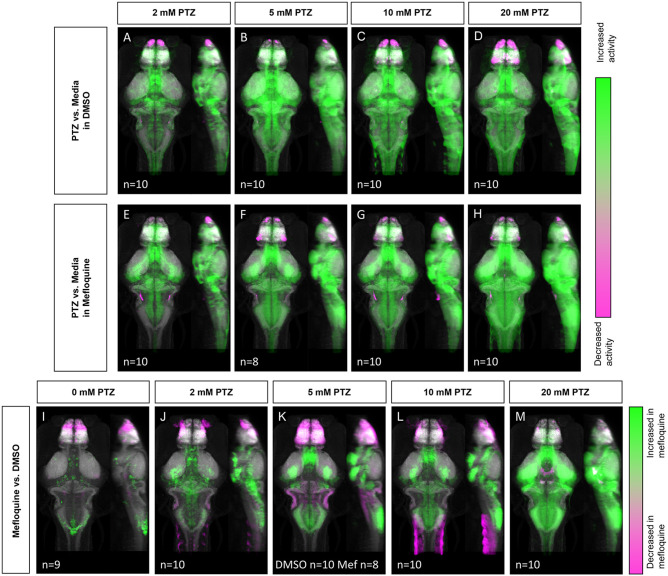
Whole-brain activity map showing significant regional differences following Cx36 blocking drug mefloquine and PTZ exposure in wild-type zebrafish larvae. Dorsal and lateral view of zebrafish larvae brain. (A–D) Images show regions with significantly increased (green) or decreased (magenta) activity compared to DMSO and embryo medium (vehicle) treated fish (n = 9). (A) 2 mM PTZ (n = 10). (B) 5 mM PTZ (n = 10) (C) 10 mM PTZ (n = 10). (D) 20 mM PTZ (n = 10). (E–H) Images show regions with significantly increased (green) or decreased (magenta) activity compared to mefloquine and embryo medium (vehicle) treated fish (n = 9). (E) 2 mM PTZ (n = 10). (F) 5 mM PTZ (n = 8). (G) 10 mM PTZ (n = 10). (H) 20 mM PTZ (n = 10). (I–M) Images show regions with significantly increased (green) or decreased (magenta) activity in mefloquine treated fish, compared to DMSO (vehicle) treated fish. (I) embryo medium (0 mM PTZ) (n = 9). (J) 2mM PTZ (n = 10). (K) 5 mM PTZ (DMSO n = 10, mefloquine n = 8) (L) 10 mM PTZ (n = 10). (M) 20 mM PTZ (n = 10). Mef: mefloquine.

Figure Data
Acknowledgments
This image is the copyrighted work of the attributed author or publisher, and ZFIN has permission only to display this image to its users. Additional permissions should be obtained from the applicable author or publisher of the image. Full text @ Front. Mol. Neurosci.