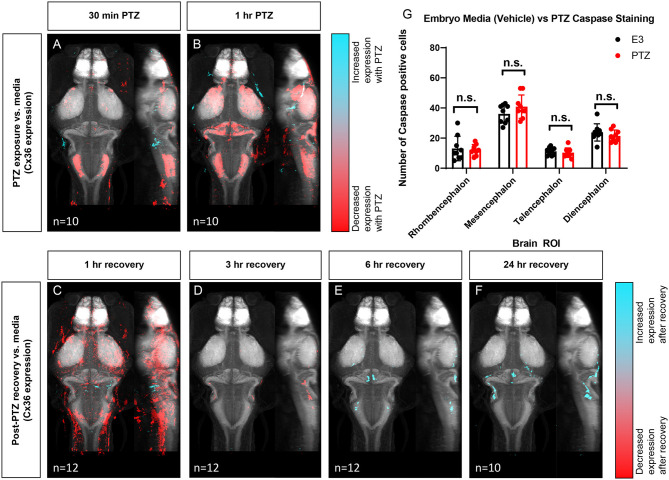
IMAGE

Figure 4

ID
ZDB-IMAGE-210130-21
Antibodies
Source
Figures for Brunal et al., 2021
Image
Figure Caption

Figure 4

Wild type whole-brain immunostaining Cx36 expression map in E3 vs. PTZ treated zebrafish larvae. Dorsal and lateral view of zebrafish larvae brain. Whole-brain expression of Cx36 using an anti-Cx36 antibody and tERK. Cyan indicates increases in Cx36 labeling in PTZ treated fish, and red indicated decreases in Cx36 labeling in PTZ treated fish. (A) After 30 min of 20 mM PTZ exposure (n = 10). (B) After 1 h of 20 mM PTZ exposure (n = 10). (C) 1-h recovery after PTZ is removed, n = 12. (D) 3 h of recovery after PTZ is removed, n = 12. (E) 6 h of recovery after PTZ is removed, n = 12. (F) 24 h of recovery after PTZ is removed, n = 10. (G) A graph depicting the number of activated caspase-3 positive cells in the rhombencephalon, mesencephalon, telencephalon, and diencephalon in wild-type fish with treatment with embryo medium (vehicle) (Black) or PTZ (Red). Data were analyzed using an unpaired t-test with Holm-Sidak's correction for multiple comparisons, n = 9.

Figure Data
Acknowledgments
This image is the copyrighted work of the attributed author or publisher, and ZFIN has permission only to display this image to its users. Additional permissions should be obtained from the applicable author or publisher of the image. Full text @ Front. Mol. Neurosci.