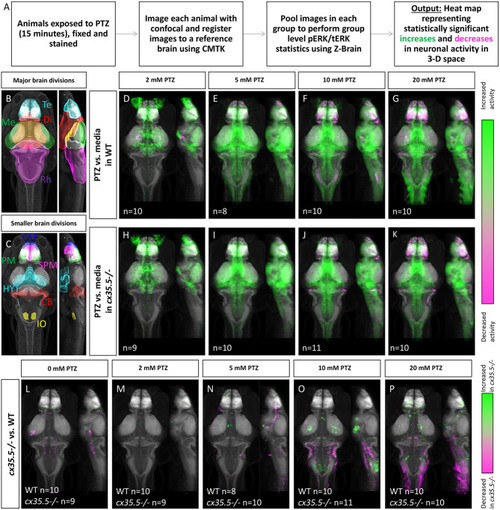
Whole-brain activity map showing significant regional differences in neuronal activity following various PTZ concentration exposure in wild-type and cx35.5-/- zebrafish larvae. (A) Schematic describing the data collection and analysis process for whole-brain activity mapping using the MAP-mapping technique. (B) Representative atlas depicting dorsal and lateral views of the 4 major brain divisions in zebrafish, showing the telencephalon (Te) in cyan, the diencephalon (Di) in red, the mesencephalon (Me) in green, and the rhombencephalon (Rh) in magenta. (C) Representative atlas depicting smaller brain regions mentioned in the text. The olfactory bulb (OLF) is labeled in blue, the pallium (PM) in green, the subpallium (SPM) in magenta, the hypothalamus (rostral, intermediate, and caudal) in cyan (HYT), the cerebellum (CB) in red, and the inferior olive (IO) in yellow. (D–G) Colors indicate ROIs with increased (green) or decreased (magenta) pERK/tERK ratio in wild-type PTZ treated groups compared to wild-type media only group. (D) 2 mM PTZ treated (n = 10) (E) 5 mM PTZ treated (n = 8) (F) 10 mM PTZ treated (n = 10) and (G) 20 mM PTZ treated (n = 10) vs. media (n = 10). (H–K) Colors indicate ROIs with increased (green) or decreased (magenta) pERK/tERK ratio in cx35.5-/- larvae PTZ treated groups compared to cx35.5-/- media only group. (H) 2 mM PTZ treated (n = 9) (I) 5 mM PTZ treated (n = 10) (J) 10 mM PTZ treated (n = 11) and (K) 20 mM PTZ treated (n = 10) vs. media (n = 9). (L–P) Colors indicate ROIs with increased (green) or decreased (magenta) pERK/tERK ratio in cx35.5-/- groups compared to corresponding wild-type groups. (L) Media treated (WT n = 10, MUT n = 9) (M) 2 mM PTZ treated (WT n = 10, MUT n = 9) (N) 5 mM PTZ treated (WT n = 8, MUT = 10) (O) 10 mM PTZ treated (WT n = 10, MUT n = 11) and (P) 20 mM PTZ treated (WT n = 10, MUT n = 10).
|
