FIGURE SUMMARY
Title

Alexander Disease Modeling in Zebrafish: An In Vivo System Suitable to Perform Drug Screening

Authors
Candiani, S., Carestiato, S., Mack, A.F., Bani, D., Bozzo, M., Obino, V., Ori, M., Rosamilia, F., De Sarlo, M., Pestarino, M., Ceccherini, I., Bachetti, T.
Source
Full text @ Genes (Basel)

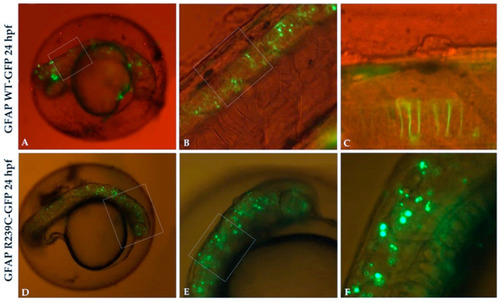
GFP expression in transgenic glial fibrillary acid protein (GFAP) wildtype (WT) and GFAP R239C embryos. (A,B) The expression of GFAP WT-GFP protein is visible along the neural tube, with very few GFAP aggregates observed. (C) High magnification of embryo in (B) shows GFAP WT protein as filamentous structures. (DF) Several aggregates of p.R239C in the brain and along the neural tube are found. Magnification: 4× (A,D); 10× (B,E); 20× (C,F). High magnification are shown by rectangular shape.

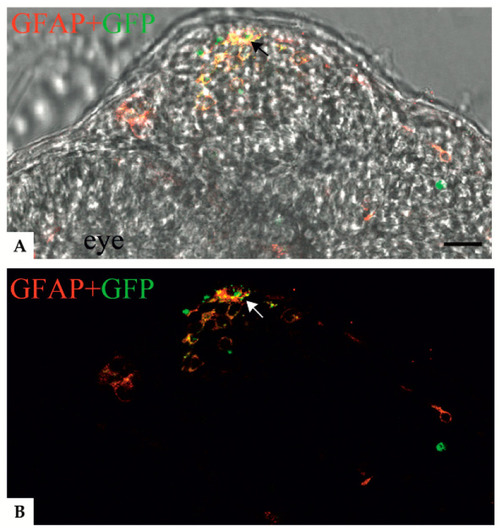
Confocal images showing colocalization between anti-GFAP signal and the GFAP R239C-GFP aggregates in zebrafish transverse sections of 24 hpf embryos. (A,B) Confocal images showing p.R239C aggregates (green) labeled by anti-GFAP antibody (red). A clear colocalization (yellow) (black and white arrows respectively in A and B) is visible in most of the cells containing green aggregates. (A) Confocal image imposed on a brightfield image of the same region. Scale bar: (A,B) 30 μm.

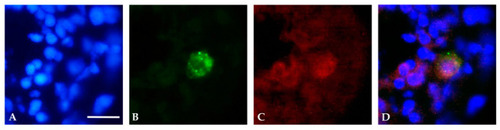
Immunofluorescence analysis of transverse sections of a 24 hpf embryo. (A) Nuclei were detected with Hoechst (blue). (B) p.R239C expression (GFP-green), (C) identified by anti-human GFAP antibody (red). (D) Representation of the overlap of the three images. Scale bar (AD): 20 μm.

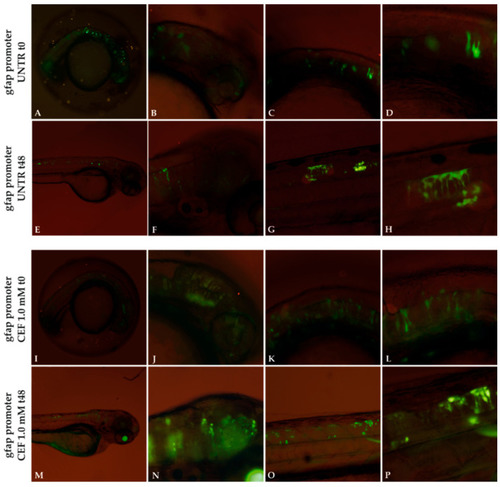
Experimental plan showing the timeline of ceftriaxone (CEF) treatments and the effects of 48 h CEF 1.0 mM treatment on embryos expressing GFAP R239C-GFP. (a). The antibiotic ceftriaxone was added 24 h after eggs microinjection. This moment was defined as “time zero” (t0). Fluorescence microscope analysis. Aggregates in untreated (UNTR) embryos are shown in figure (AD) at 24 hpf (t0) and from (EH) at 72 hpf (t48), corresponding to the start and end points of CEF treatment. Figure (IL) show aggregates at 24 hpf (t0), while figure (MP) show aggregates at 72 hpf (t48), after 48 h of treatment with CEF 1.0 mM. Magnification: 4× (A,E,I,M); 10× (B,C,F,G,J, K,N,O); 20× (D,H,L,P).

Effect of 1.0 mM CEF treatment on gfap promoter. Untreated (UNTR) embryos expressing gfap promoter as filamentous structures (AH) at 24 and 72 hpf, respectively. CEF effects on embryos at t0 (24 hpf) (IL) and after 48h of treatments (MP). Magnification: 4× (A,E,I,M); 10× (B,C,F,G,J,K,N,O); 20× (D,H,L,P).

Experimental plan showing the timeline of heat-shock treatments and effects of thermal shock on p.R239C aggregates. (a) At 24 hpf, embryos were incubated for 1 h at 37 °C and then recovered at 28 °C. Fluorescence microscope analysis was performed after 3 (t3) and 24 h (t24) from the end of the 1 h heat shock (t1). In Figure (AH), mutant embryos not shocked (unshocked) are presented at 24 hpf, showing diffuse aggregate formation before and after 3 h. Figure (IL) show GFAP p.R239C aggregates in embryos at 24 hpf, while, in figure (MP), the thermal shock effect is shown after 3 h on GFAP p.R239C aggregates. Magnification: 4× (A,E,J,M); 10× (B,C,F,G,J,K,N,O); 20× (D,H,L,P).

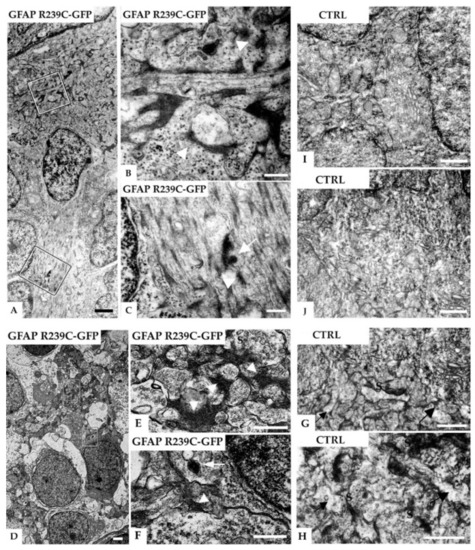
Electron micrographs of radial glial cells in the subventricular and neuropil region in the telencephalon of a 5 dpf zebrafish injected with GFAP-R239C-GFP plasmid. (A) A glial cell contacts the ventricular brain surface covered by the tela choroidea (top) and shows many electron-dense profiles. In (B,C), higher magnifications of the marked areas in (A) reveal that the dark profiles are associated with filaments (arrowheads) and sometimes surrounded by a membrane (arrows), the latter consistent with lysosomal packaging. In another example of the neuropil region shown in (D), at higher magnifications of the marked areas depicted in (E,F), glial processes containing electron-dense fibrillar material can be seen (arrowheads). The arrow points at a membrane-bound vesicle containing clustered electron-dense material, featuring a lysosome. In (GJ), electron microscopic analyses on control wildtype embryos of similar regions are shown, i.e., subventricular glial processes in (G,H) and neuropil region in the telencephalon in (I,J). No such electron-dense material in glial processes, identified by their irregular shape in the synaptic regions (arrows), was detected in the control tissue. Note that the dark bands are postsynaptic densities (S: presynaptic terminals). Scale bars: (A,D) 1 µm; (B,C) 250 nm; (EJ) 500 nm.

Electron micrographs of the telencephalon of 3 dpf zebrafish embryos expressing GFAP R239C-GFP.(A) The formation of lysosomes (arrows) was confirmed in the electron micrographs of the telencephalic region from a 3 dpf old zebrafish, injected with GFAP R239C-GFP plasmid and treated with 1.0 mM ceftriaxone for 48 h. (B) In contrast, in mutant untreated embryos, fewer and smaller lysosomes were seen at this embryonic stage. Images were captured with Zeiss EM10 or a LEO 912AB transmission electron microscope. Scale bar: 2.5 µm.

Acknowledgments
This image is the copyrighted work of the attributed author or publisher, and ZFIN has permission only to display this image to its users. Additional permissions should be obtained from the applicable author or publisher of the image. Full text @ Genes (Basel)